The indicator is pretty straight-forward and works like virtually all other NinjaTrader indicators. Once installed, simply select it from the 'Indicators' dialog box, set the options as desired (defaults are pretty sane) and start using it. I tried to give all the options names that make sense and, if you hover over them with your mouse, I've included more detailed descriptions as appropriate. Overall, I don't think there's too much that's a mystery. However, this page will provide an overview just in case something doesn't make sense to you.
Download Instructions
You can download the latest version of AB-PowerX here . Make sure you save the file somewhere you can find it easily -- your Downloads folder or your Desktop are usually the easiest places. If you wish to verify your download, the SHA-256 checksum is displayed below the download button for each release on the Downloads page.
Installation, Upgrades & Removal
installation
Open NinjaTrader and go to the main control window (the one with the main program menu) and select Tools | Import | NinjaScript Add-On... [Installation screenshot 1]
Navigate and find the ZIP file you downloaded. Select it and click "Open". NinjaTrader will install the file for you.
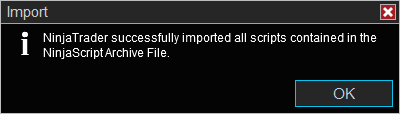
Assuming there are no errors, you should see a dialog box saying "NinjaTrader successfully imported all scripts contained in the NinjaScriptArchive File." [Installation screenshot 2]
That's it, you're done!
upgrading
Upgrading involves removing the previous version and then installing the new version just as you did in the initial installation.
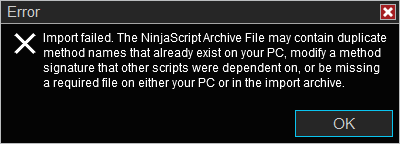
You MUST remove the previous version or NinjaTrader will fail to perform the upgrade. If you don't remove the previous version, you will see a dialog box saying "Import failed..." [Screenshot showing upgrade error]
Follow the steps in the "Uninstallation" section below to remove the current (old) version.
Now, follow the steps in the "Installation" section above to install the newest version. Just make sure you choose the newest ZIP (it will have the highest version number) and that will do the "upgrade" for you. Upgrading really is just installing the latest version. Your existing templates will be unaffected and will be automatically reapplied after the upgrade.
removal
It is recommended you remove any custom indicators from within NinjaTrader instead of deleting the file manually (though I've never experienced any problems manually deleting files). We will go through the recommended procedure here.
for packaged DLL versions
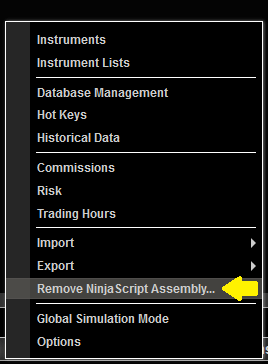
On the main NinjaTrader Control Center window (the one with the main program menu), select Tools | Remove NinjaScript Assembly [DLL uninstallation screenshot 1]
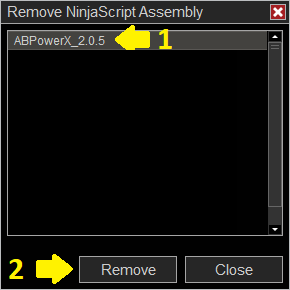
A new window will appear asking you to select which assembly you want to remove. Select ABPowerX_version (where '_version' is the currently installed version number) and click "Remove". [DLL uninstallation screenshot 2]
NinjaTrader will display a confirmation dialog box asking if you're sure. You are. Say Yes.
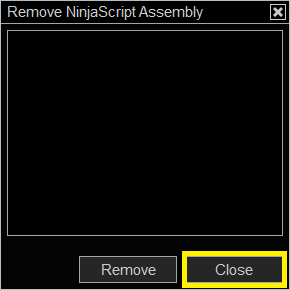
Assuming no errors, you will get a success message. Click OK to close the dialog box. [DLL uninstallation screenshot 3]
Click CLOSE on the "Remove NinjaScript Assembly" dialog box to close it. [DLL uninstallation screenshot 4]
AB-PowerX is now uninstalled. If you removed the indicator as part of the upgrade process, please follow the "Installation" section above to complete the upgrade.
for packaged script file versions
On the main NinjaTrader Control Center window (the one with the main program menu), select New | NinjaScript Editor [Script uninstallation screenshot 1]
On the right-side of the NinjaScript Editor window you will see a panel called NinjaScript Explorer. In that panel, you will see a list of folders. If you don't see a tree display but instead see a vertical tab labelled NinjaScript Explorer, click it to expand the panel. [Script uninstallation screenshot 2]
In the NinjaScript Explorer panel, double-click on the AddOns folder to expand it, if necessary. Find the ABPowerX_addon file and right-click on it. Select Remove. [Script uninstallation screenshot 3]
NinjaTrader will ask if you are sure you want to remove the file. Say Yes.
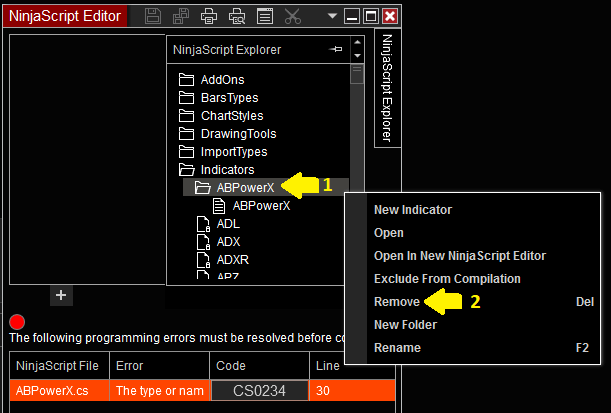
At this point, NinjaTrader will recompile its indicators and you WILL see an error (code CS0234). Ignore it for now.
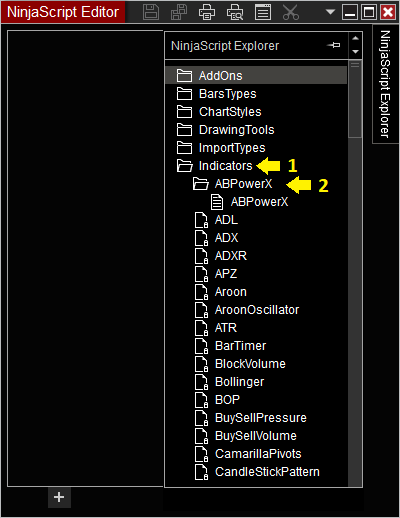
In the NinjaScript Explorer panel, double-click on the Indicators folder to expand it, if necessary, and find the ABPowerX folder. Double-click to expand this folder.[Script uninstallation screenshot 4]
Right-click on the ABPowerX FOLDER and select Remove. [Script uninstallation screenshot 5]
NinjaTrader will ask if you are sure you want to remove the FOLDER and will warn that all scripts within will be lost. This is what we want. Say Yes.
Once again, NinjaTrader will recompile its scripts but, this time, you should no longer receive any errors.
Review the NinjaScript Explorer panel and notice that 'ABPowerX' no longer appears in either the 'AddOns' or 'Indicators' folders.
AB-PowerX is now uninstalled. If you removed the indicator as part of the upgrade process, please follow the "Installation" section above to complete the upgrade.
Using In NinjaTrader
You add the indicator to your chart like any other. In a chart window, right-click and select Indicators to open your indicators panel. Now look for a folder called ABTrading (in versions before v2.6 this folder is called ABPowerX) on the left side of the window. Double-click to open the folder and then double-click on the version of the indicator you have installed (you should only ever have one version). You can then customize any options you want and click 'OK' to add the indicator. You may change any options or remove the indicator at any time by opening your indicators panel again.
Interpretation
Long setup
Let's go ahead and take a look at a LONG trade setup first.
The '*' shows a bullish trigger bar. As you can see, the bars are coloured green to indicate bullish momentum. All lines are drawn on the chart at the close of this bar.
At (1) the trade is entered intra-bar since the bar passed the trigger line at (2). You can see a marker (upward triangle) is drawn as a visual reminder that you should be long.
(2) shows the 'Trade Helper - Trigger Line'. It shows that, based on your account size and risk tolerance or selected fixed contract amount, you should be trading LONG (up arrow) 2 contracts with an entry price at 4226.75.
(3) shows the 'Trade Planner' STOP line. It is telling you your sell-stop should be at 4223.75 for a cumulative risk of 24 ticks or $300.00. I am using cumulative mode in this example so it takes the per-contract risk numbers and multiplies by the number of contracts being traded. You can turn this off to see 'per-contract' instead.
(4) shows the 'Trade Planner' TARGET line. It is recommending an exit at 4232.75 based on the 'target multiple' parameter. If hit, you will make 48 ticks or $600.00. Again, I am using cumulative mode here. In 'per-contract' mode, it would display 24 ticks and $300.00.
(5) shows a bar hitting our target. Great trade!
Short setup
Now, let's take a look at a SHORT trade setup.
The '*' shows a bearish trigger bar. As you can see, the bars are coloured pink to indicate bearish momentum. All lines are drawn on the chart at the close of this bar.
At (1) the trade is entered intra-bar since the bar passed the trigger line at (2). You can see a marker (downward triangle) is drawn as a visual reminder that you should be short.
(2) shows the 'Trade Helper - Trigger Line'. It shows that, based on your account size and risk tolerance or selected fixed contract amount, you should be trading SHORT (down arrow) 2 contracts with an entry price at 4238. 00.
(3) shows the 'Trade Planner' STOP line. It is telling you your buy-stop should be at 4240.50 for a risk of 10 ticks or $125.00. I am using 'per-contract' mode this time, so these numbers would need to be multiplied by the contracts being traded. This is the opposite setting used in the 'long' example.
(4) shows the 'Trade Planner' TARGET line. It is recommending an exit at 4233.00 based on the 'target multiple' parameter. If hit, you will make 20 ticks or $250.00 per-contract. If, like in the 'long' example, you were using 'cumulative' mode, this would display 40 ticks for a total of $500.00.
(5) shows that the same bar as our entry ended up hitting our target. Another great trade that actually kept going quite a bit passed our target!
Tips & Ticks
Sometimes it can be difficult to see the Trade Planner boxes at the hard-right edge of your screen. You can make this easier by adding a 'right-margin' to your chart. Right-click on your chart and select Properties. In the dialog box, you will see an option called Right side margin. Set this somewhere between 150-250 (pixels) depending on your screen resolution. That should give you enough padding to fully see the boxes.
Remember that Trigger-Line and Trade-Planner labels are set separately!
You can turn off the label boxes entirely if you just want to see text. The boxes, I think, make the labels more visible. If you don't like the extra clutter, uncheck "Display label box" in the "Trigger Line Label" and/or "Trade Planner Labels" section.
You can customize the label box appearance using a combination of "Label box opacity", "Label box outline" and "Dotted outline" options. You don't have to use the defaults!
You can turn off the label box background by setting its opacity to 0. This is the default on the 'Trade-Planner' level labels.
PLEASE feel free to make suggestions for new features, changes to existing ones, report any bugs/issues or provide any feedback you'd like. You can email me using the links on this site or, if you are familiar with git, you can file an issue in the git repo.
Parameters
Click on any of the options below to expand it and read a more detailed explanation of what the particular parameter does. This section will be updated with each new release version.
display options
indicator settings
trade helpers
account and risk
trigger lines
trigger line label
trade planner
trade planner labels
contact me
Want to stay updated on new releases? Have questions or found a bug? Want to submit a feature request? Feel free to email me by clicking the button below. I'll be happy to answer any questions you have, help you get the indicator set-up, or let you know about incorporating your suggestion(s) into future versions. If you know how to program for NinjaTrader or in C#/.NET in general and want to contribute, email me using the button below or file an issue or pull request in the git repo (preferred).
email me