The indicator is easy to use and works like most other NinjaTrader indicators. Once installed, simply select it from the 'Indicators' dialog box in the ABTrading folder, set the options as desired (defaults are pretty sane) and start using it. I tried to give all the options names that make sense and, if you hover over them with your mouse, I've included more detailed descriptions as appropriate. Overall, I don't think there is too much that's a mystery. More detailed usage information can be gleaned by viewing the screenshots which cover the major implemented features. That being said, this page will provide an overview just in case something doesn't make sense to you.
Download Instructions
You can download the latest version of AB-CleanChart here . Make sure you save the file somewhere you can find it easily -- your Downloads folder or your Desktop are usually the easiest places. If you wish to verify your download, the SHA-256 checksum is displayed below the download button for each release on the Downloads page.
Installation, Upgrades & Removal
installation
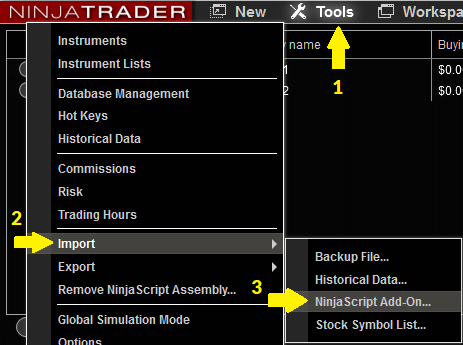
Open NinjaTrader and go to the main control window (the one with the main program menu) and select Tools | Import | NinjaScript Add-On... [Installation screenshot 1]
Navigate and find the ZIP file you downloaded. Select it and click "Open". NinjaTrader will install the file for you.
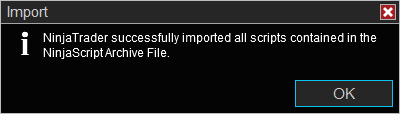
Assuming there are no errors, you should see a dialog box saying "NinjaTrader successfully imported all scripts contained in the NinjaScriptArchive File." [Installation screenshot 2]
That's it, you're done!
upgrading
Upgrading involves removing the previous version and then installing the new version just as you did in the initial installation.
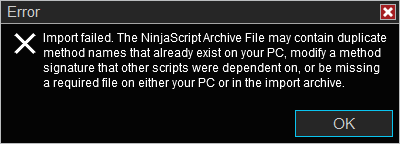
You MUST remove the previous version or NinjaTrader will fail to perform the upgrade. If you don't remove the previous version, you will see a dialog box saying "Import failed..." [Screenshot showing upgrade error]
Follow the steps in the "Uninstallation" section below to remove the current (old) version.
Now, follow the steps in the "Installation" section above to install the newest version. Just make sure you choose the newest ZIP (it will have the highest version number) and that will do the "upgrade" for you. Upgrading really is just installing the latest version. Your existing templates will be unaffected and will be automatically reapplied after the upgrade.
removal
It is recommended you remove any custom indicators from within NinjaTrader instead of deleting the file manually (though I've never experienced any problems manually deleting files). We will go through the recommended procedure here.
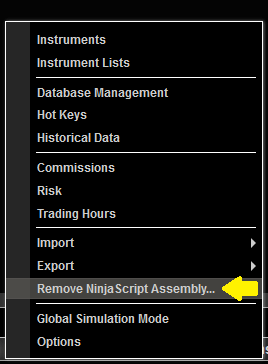
On the main NinjaTrader Control Center window (the one with the main program menu), select Tools | Remove NinjaScript Assembly [DLL uninstallation screenshot 1]
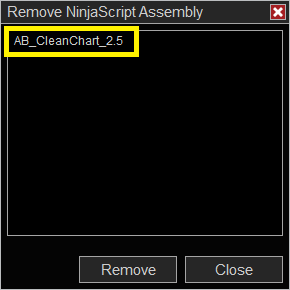
A new window will appear asking you to select which assembly you want to remove. Select ABCleanChart_version (where '_version' is the currently installed version number) and click "Remove". [DLL uninstallation screenshot 2]
NinjaTrader will display a confirmation dialog box asking if you're sure. You are. Say Yes.
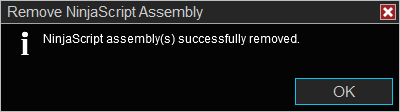
Assuming no errors, you will get a success message. Click OK to close the dialog box. [DLL uninstallation screenshot 3]
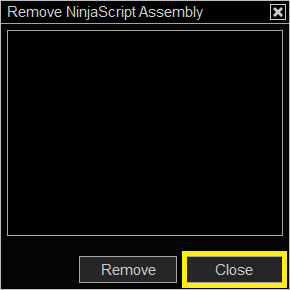
Click CLOSE on the "Remove NinjaScript Assembly" dialog box to close it. [DLL uninstallation screenshot 4]
AB-CleanChart is now uninstalled. If you removed the indicator as part of the upgrade process, please follow the "Installation" section above to complete the upgrade.
Using In NinjaTrader
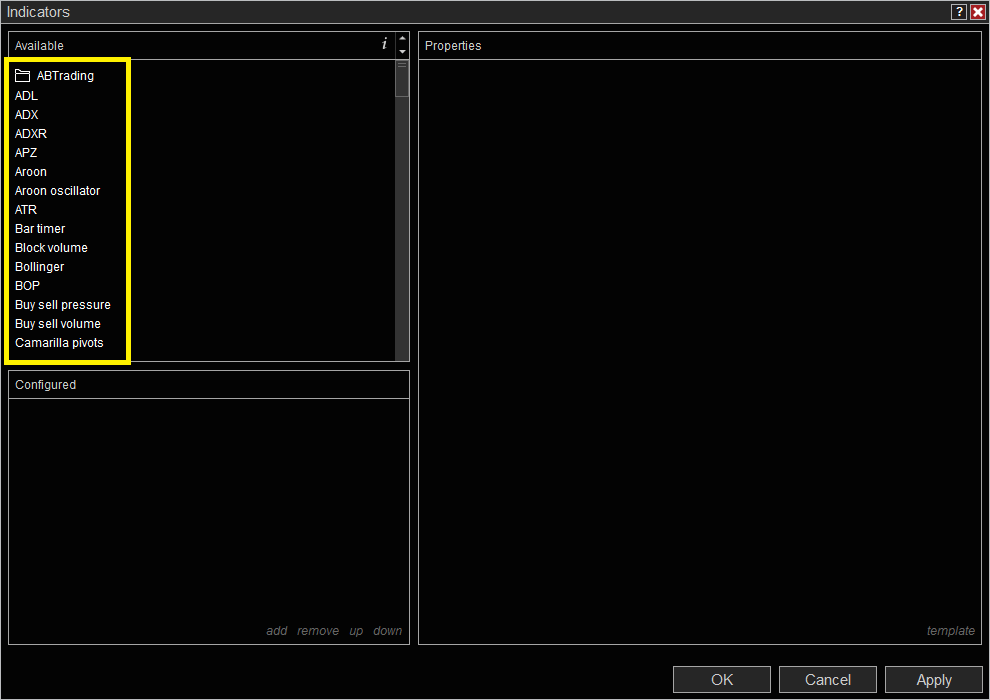
You add the indicator to your chart like any other. In the chart window, right-click and select Indicators (or click the indicators button in the toolbar) to open your indicators panel. Now look for a folder called "ABTrading" on the left side of the window. Double-click to open the folder and then double-click on AB-CleanChart (version) to activate the indicator. You can then customize any options you want on the right side of the window and click "OK" to add the indicator. You may change any options or remove the indicator at any time by opening your indicators panel again.
Like most tools for NinjaTrader, it is easiest to just use it and see what happens. The major features of the indicator are fairly well documented through the screenshots on the homepage . There are, however, a few extra notes that may be worth reviewing here as they are unique to how this tool has been implemented.
general
The best way to see how this indicator tool works is to add some indicators, drawings and maybe some text and/or chart markers to a dummy chart. Then, start playing with the toggles. You will see how they interact and what the various options do. The most important aspects to understand are exclusions (see below) and the link between the Drawing Toggle and the Text and Marker Objects toggles (directly below). Other than these items, everything is pretty obvious within a few minutes of playing with the toggles.
drawing toggle: text and markers
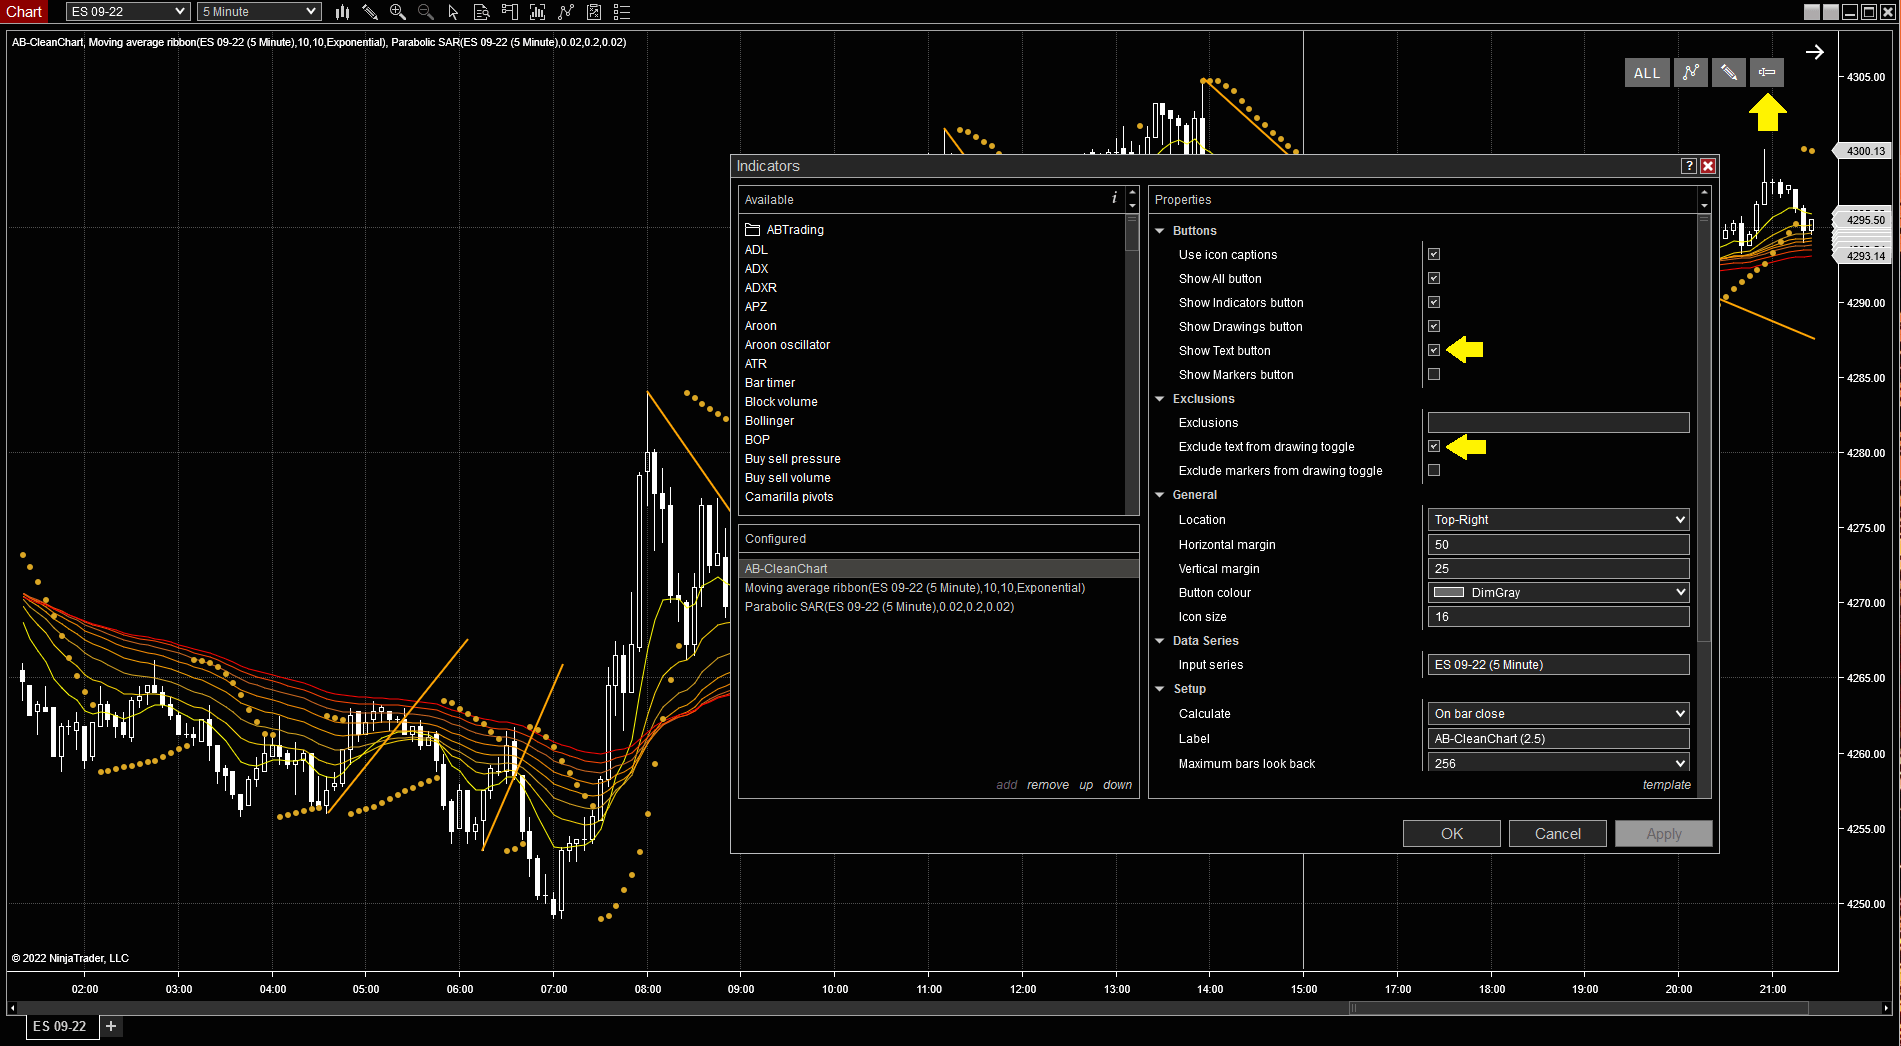
By default, the Drawing Toggle will affect all drawing items as defined by NinjaTrader. This includes text objects and chart markers (that's why they are in the 'drawing' menu). However, it may not always be desirable for these to all be treated as one block when dealing with a toggle tool such as this one. As such, you can unlink one or both of these items from the Drawing Toggle in the indicator properties dialog box by checking the appropriate boxes:
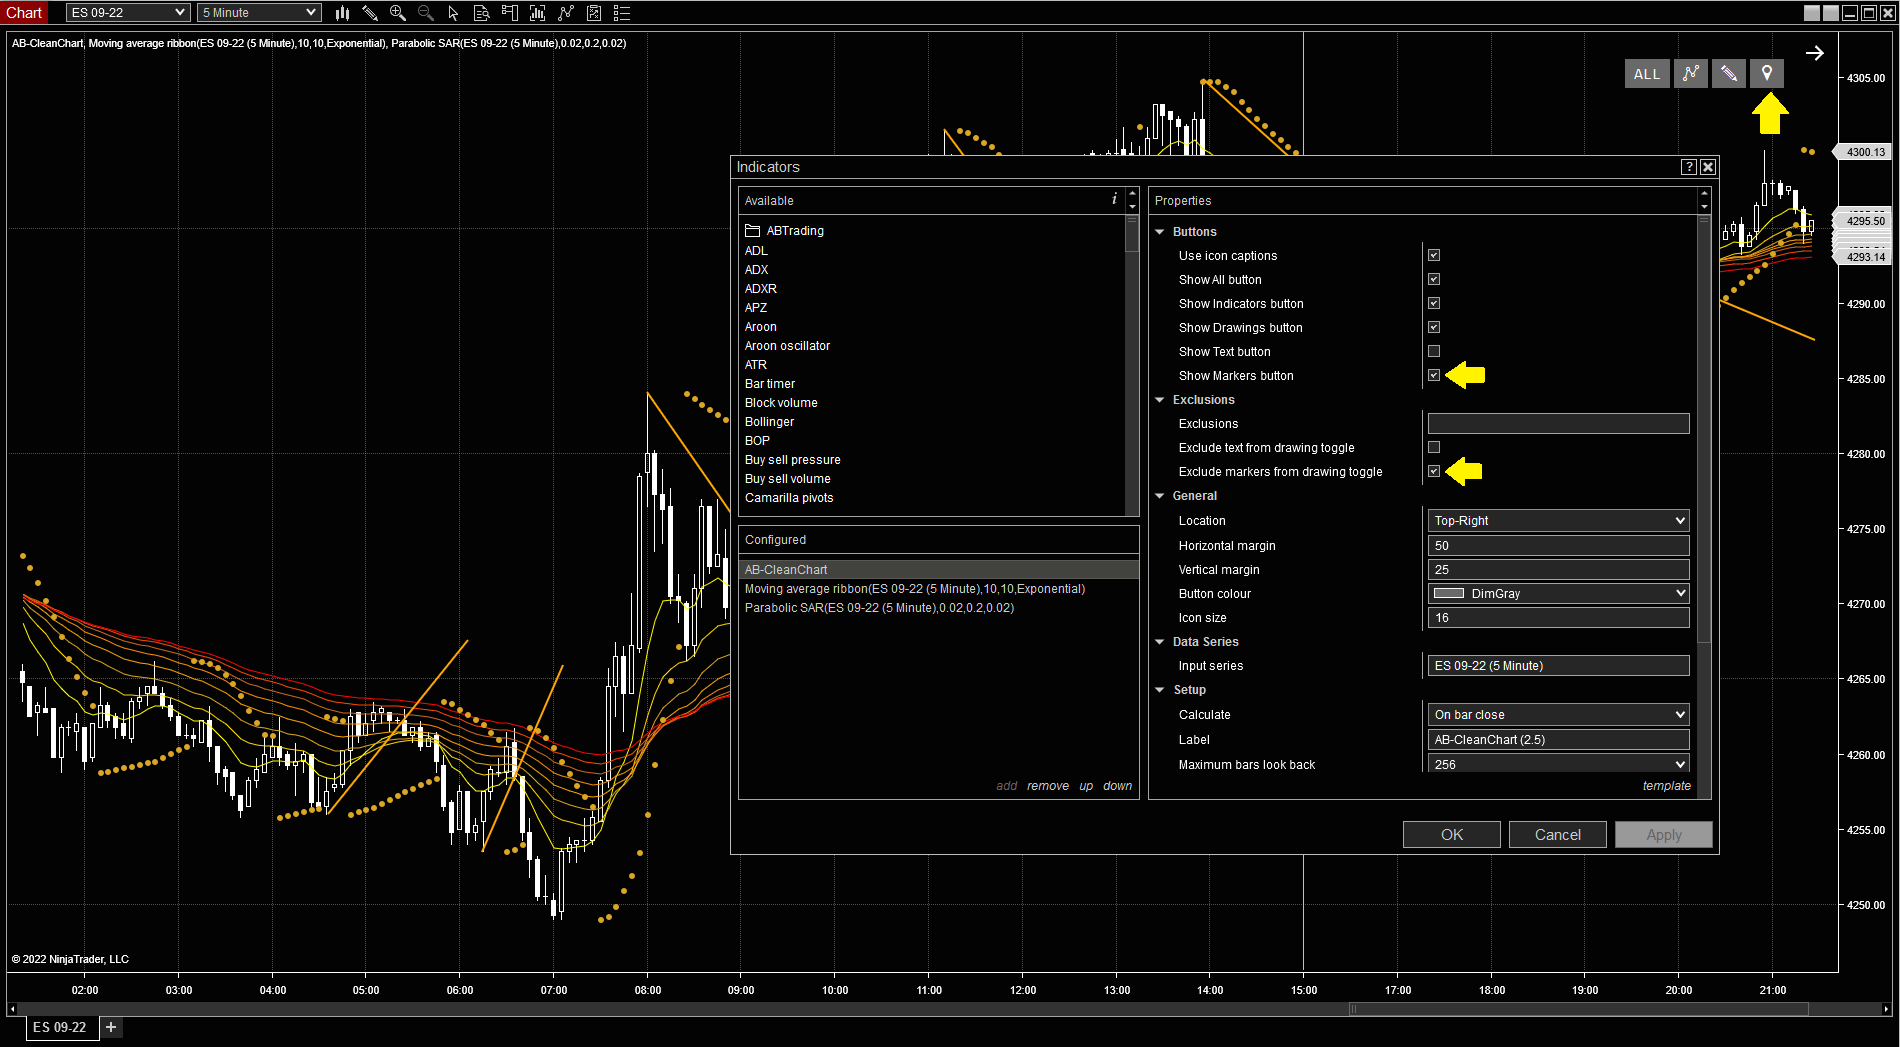
- Exclude text from drawing toggle: The Drawing Toggle will no longer affect text items. If you wish to toggle them, you should enable the 'Show Text button' option. [Toggles: Text]
- Exclude markers from drawing toggle: The Drawing Toggle will no longer affect chart marker items (dot, square, up arrow, down arrow, etc.) If you wish to toggle these items, you should enable the 'Show Markers button' option. [Toggles: Markers]
It should be noted that simply displaying the Text and/or Markers toggle buttons does not sever the link with the Drawing Tools toggle. The buttons will allow independent toggling but their toggle state will be overridden by the Drawing Tools toggle unless the 'Exclude' parameters are enabled as shown above. This can be clearly seen by the shading state of the buttons on the screen. Again, I encourage you to play with these scenarios to see them in action and understand what is happening.
Finally, regardless of whether the Text and/or Markers toggles are linked to the Drawing Tools toggle, the ALL button will still toggle these elements. This makes sense though is perhaps counter-intuitive at first. If this were not the case, the ALL button could never fully toggle all elements and provide a naked chart.
toggle drawing objects from indicators
By default, the Drawings toggles (Drawings, Text and Chart Markers) only affect user-drawn objects. Objects rendered by indicators are handled, along with the indicator that drew them, by the Indicator toggle. However, some indicators may render 'global drawing objects' meaning that an indicator on one chart (source) may draw lines/channels/etc. on another chart (target). If you wanted to toggle drawings made by the source chart but drawn on the target chart, you would need to toggle the indicator itself (probably on the source chart). The way around this is to activate AB-CleanChart on your target chart and enable the Drawings include indicator objects property. This will allow AB-CleanChart to toggle drawing objects created by indicators, even 'global drawing objects'. Careful though, this will affect all drawing objects from all indicators on your chart!
exclusions
Exclusions are where this tool really becomes useful. By being able to toggle everything except certain elements, you can quickly create new ways of looking at your charts. For example, say you have a chart with several indicators to determine trend. To time your entries you use simple counter-trend lines. The indicators take up a lot of chart real estate and contribute a lot of clutter. In this case, you may wish to exclude the trend lines so they'd be the only thing on your charts after toggling. Now, you can view the 'big picture' and, when you want to isolate your entry, toggle everything with the ALL button to isolate only your trend lines.
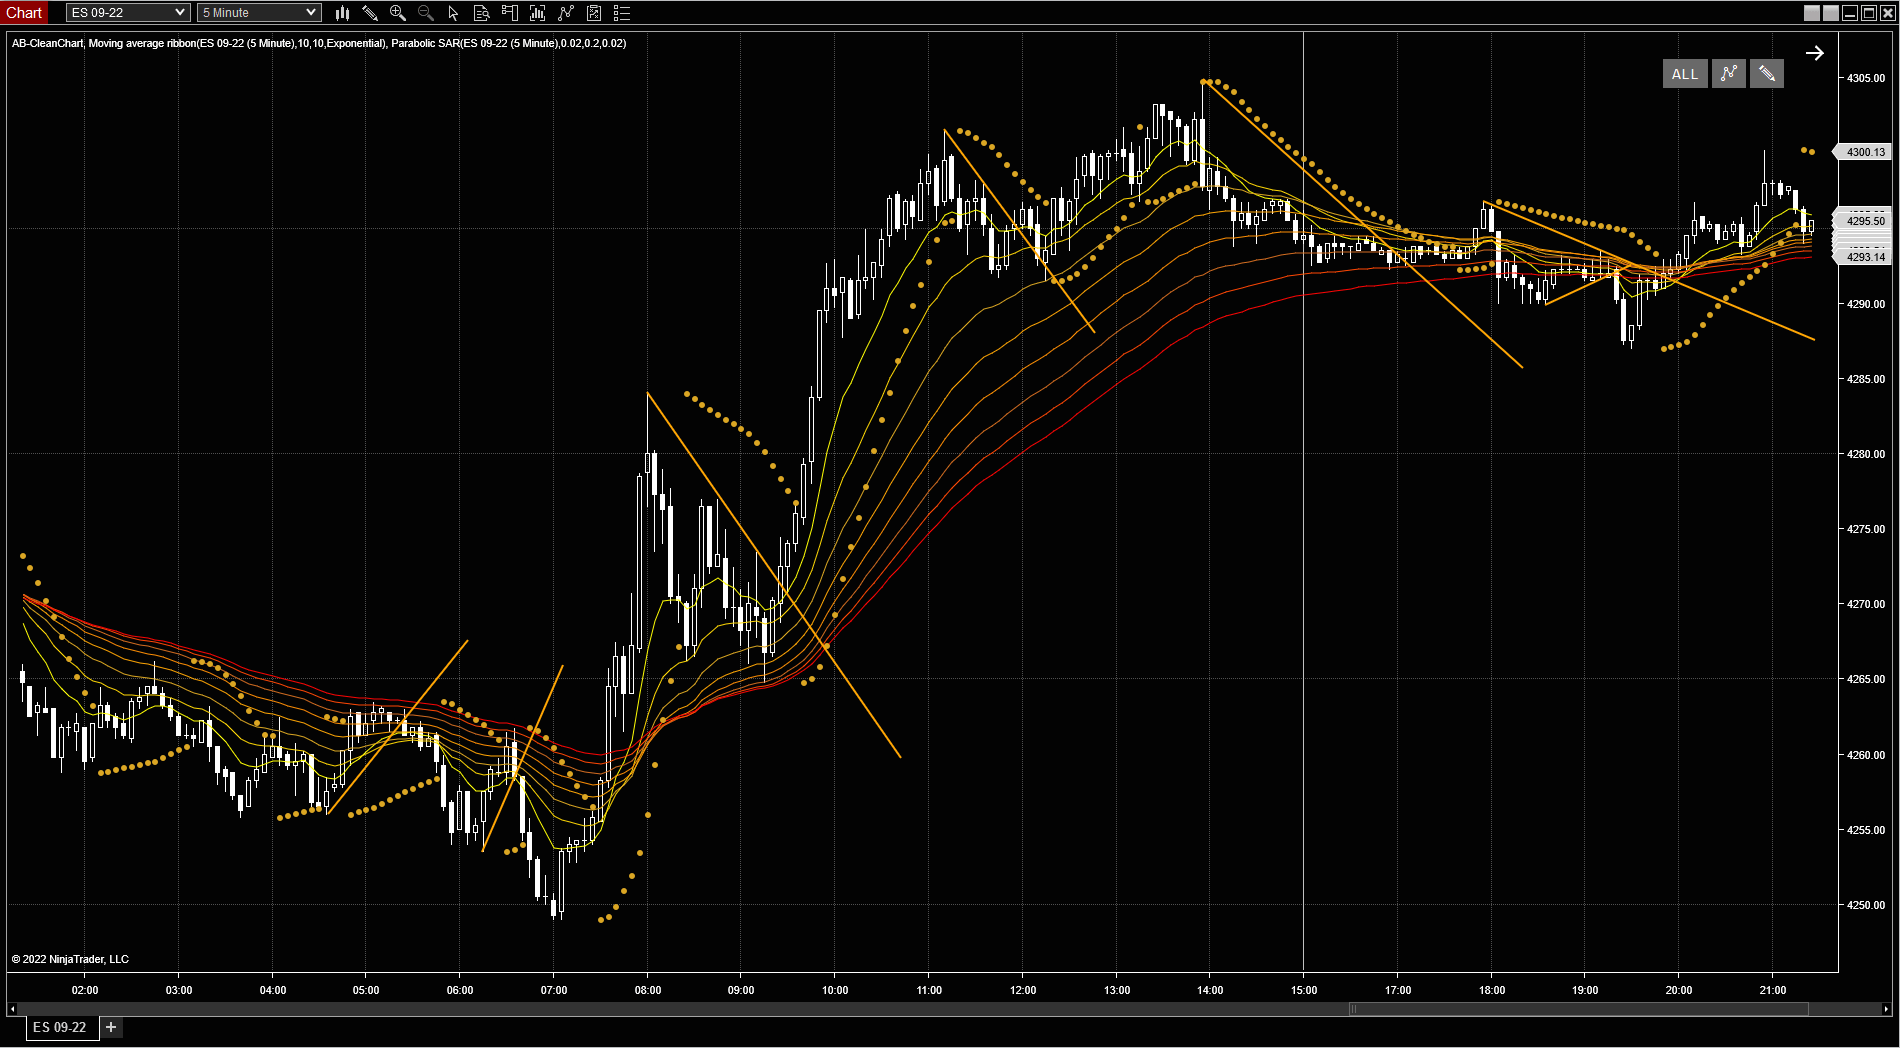
Let's run through this scenario one step at a time. To start, let's simulate a potential workspace by adding a Moving Average Ribbon, Parabolic SAR and some counter-trend lines (don't worry about drawing anything properly, we're just pretending here). Finally, add AB-CleanChart with default settings. [Exclusions: Initial state]
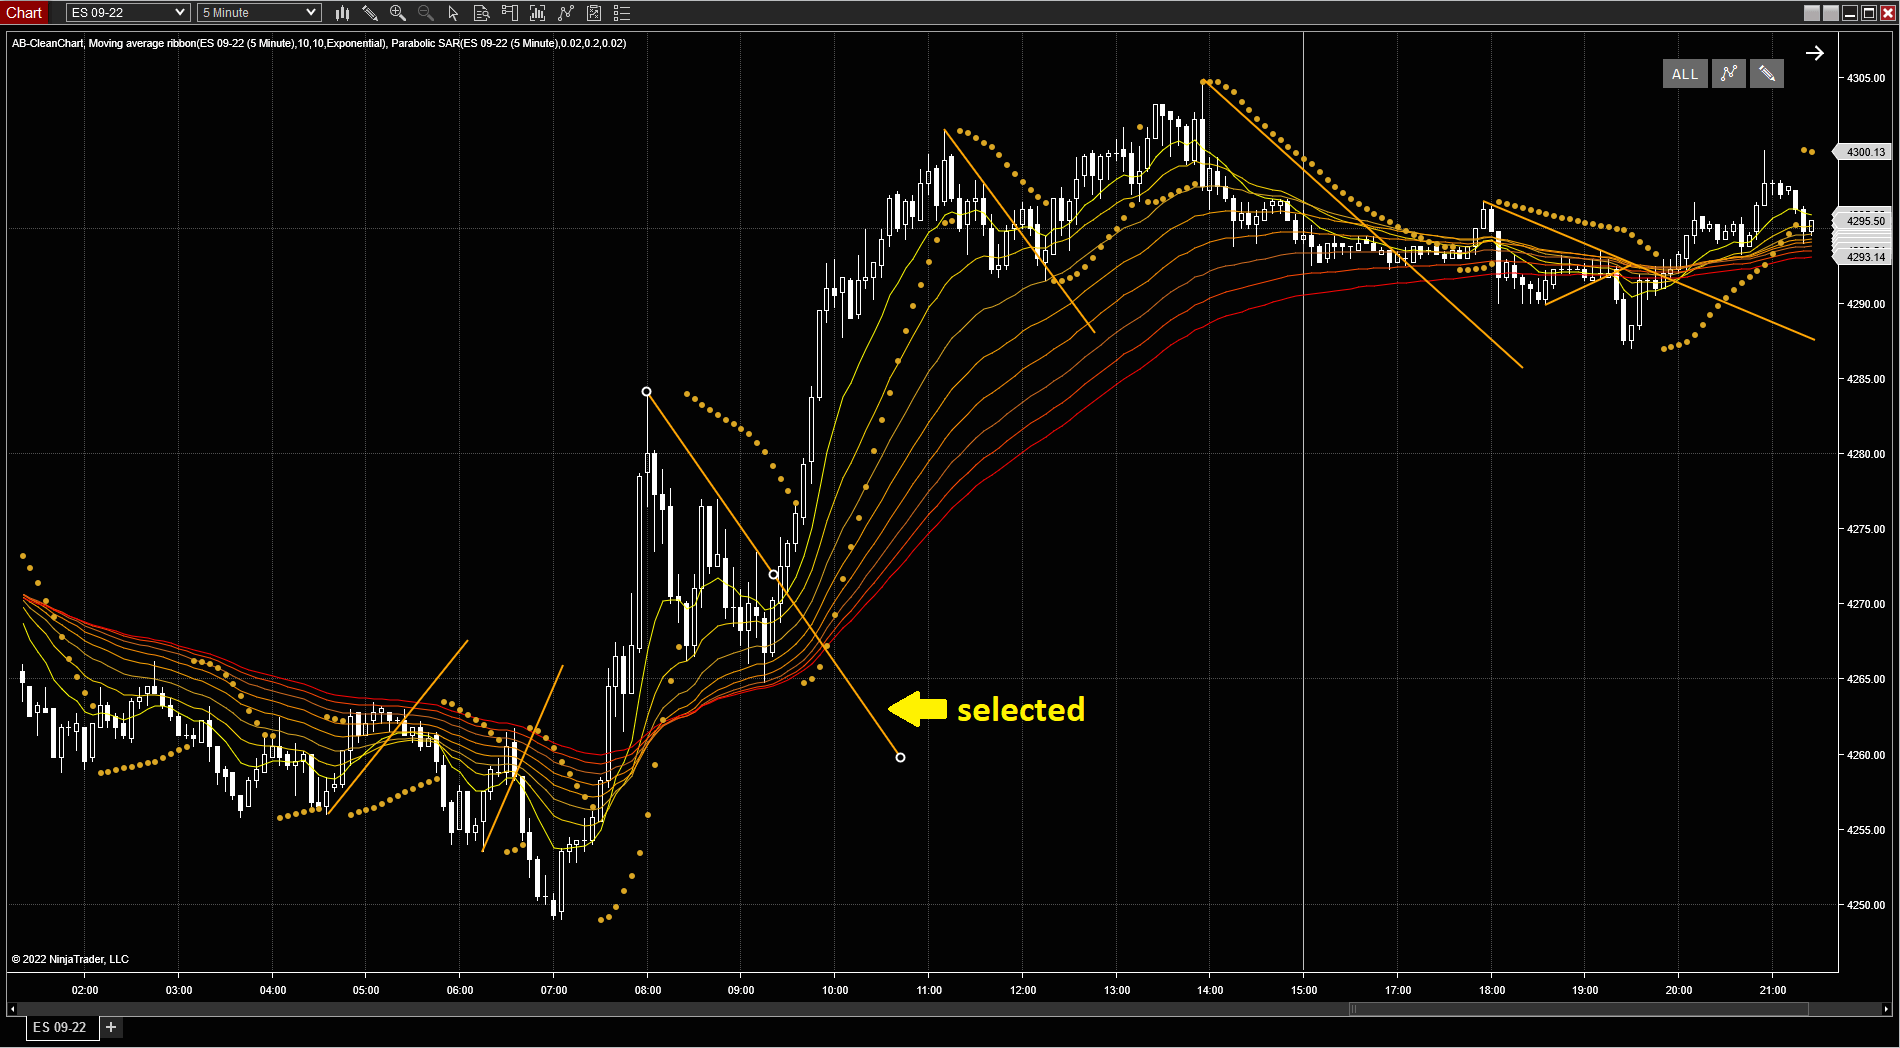
- Click to select any counter-trend line. Selected items are noticed by the indicator and queued for exclusion. [Exclusions: Selected item]
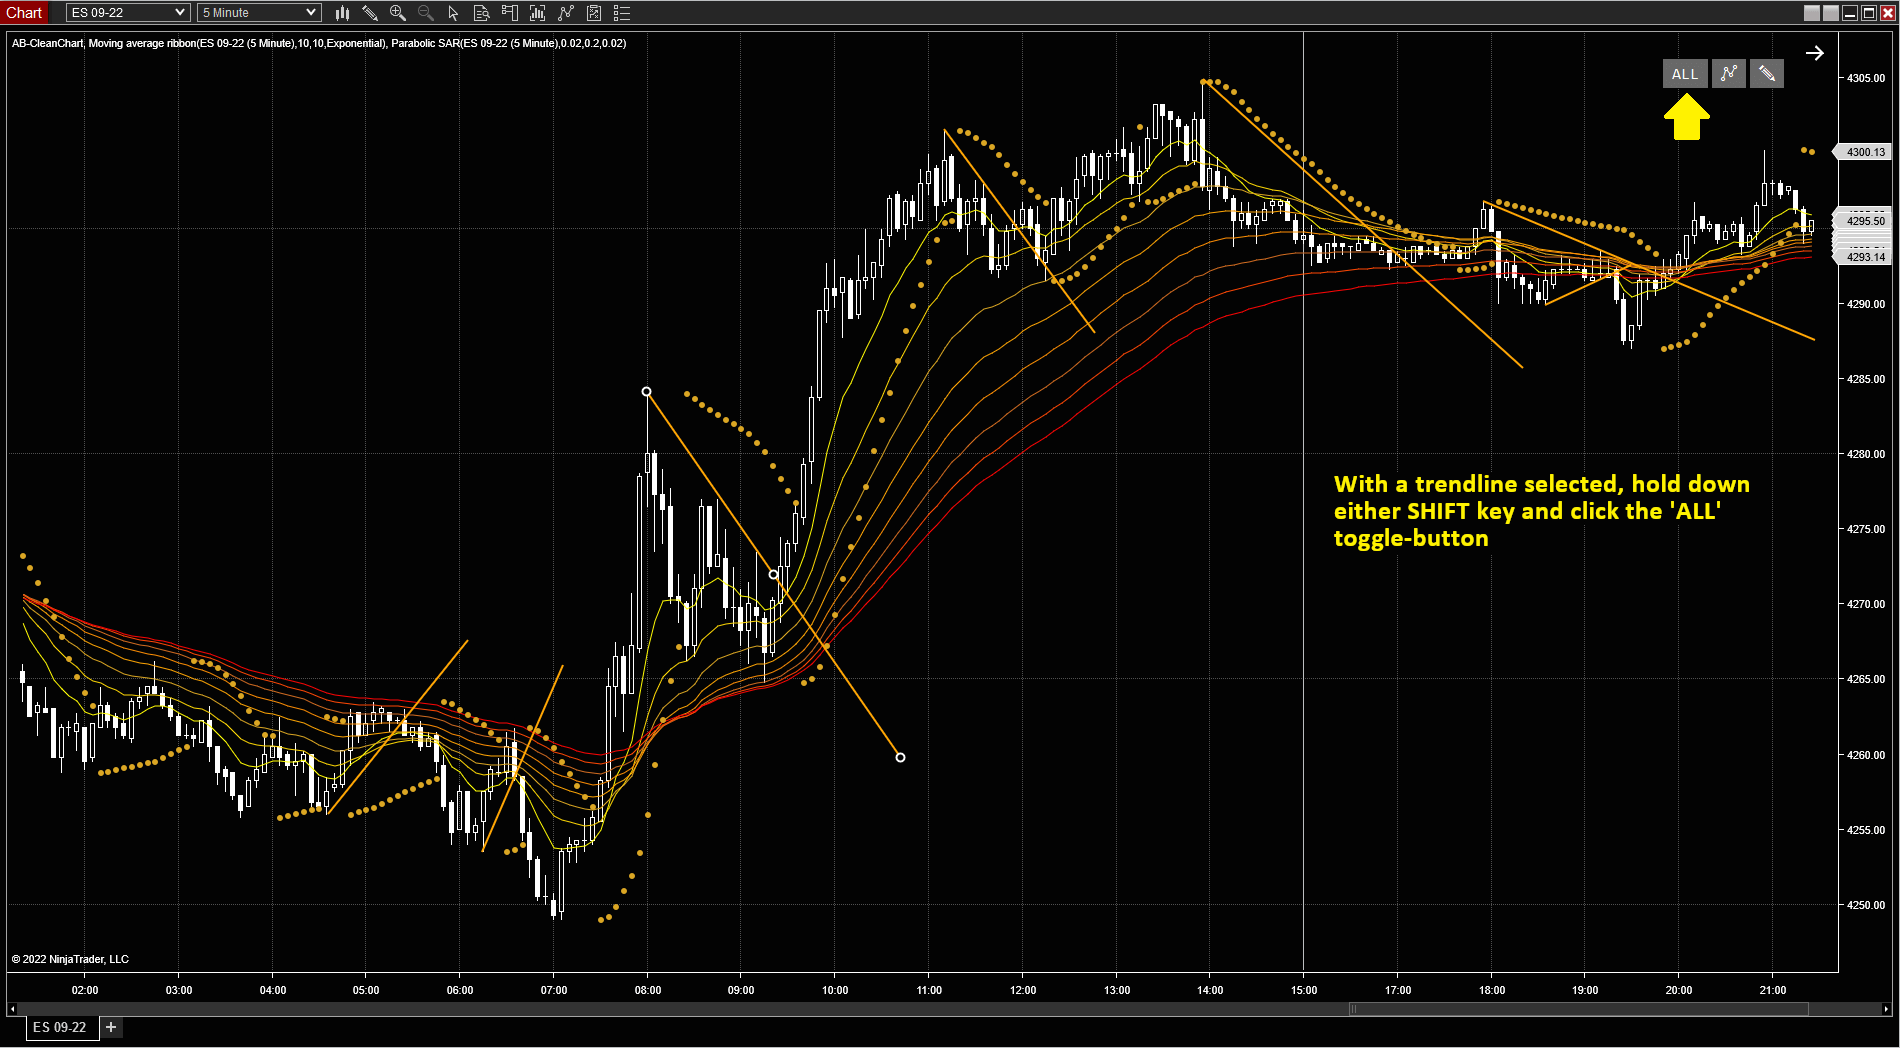
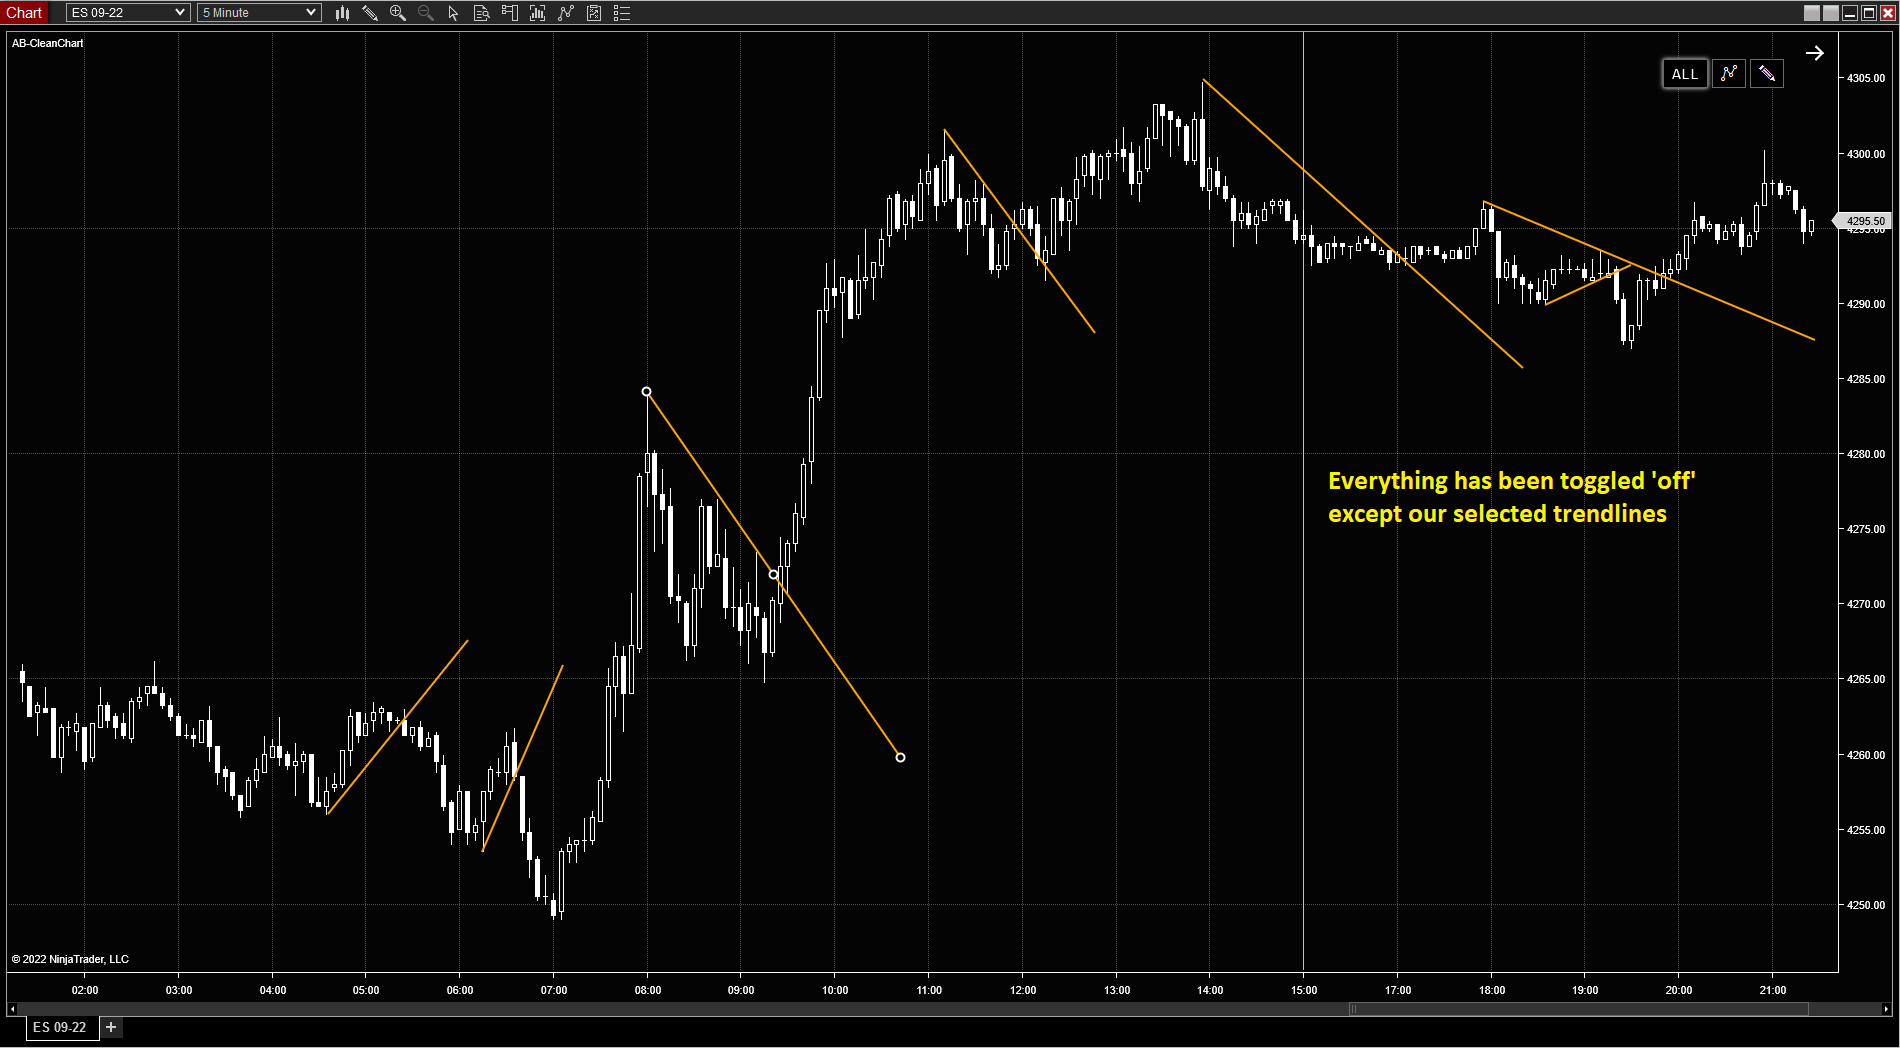
- Since this is a drawing object, we can use the Drawing Tool toggle to add the trend lines to the exclusion list. However, we want to toggle everything else anyway and only leave the trend lines visible. Thus, we can use a shortcut and click the ALL button to do two steps at once -- add to the exclusion list and then hide everything else. Let's do that, click the All button while holding down the SHIFT key (either left or right). [Exclusions: Toggle ALL]
- Notice that everything has been toggled (thanks to the ALL button) except our selected trend lines! [Exclusions: Toggle result]
- IMPORTANT: Prior to Version 3.0, to make our exclusion 'stick', we need to click on the chart to deselect the trend line element. If we don't do this and instead click another toggle button, then our trend lines will be removed from the exclusion list. The logic is simple: If a selected item is not on the exclusion list, add it. If it is on the exclusion list (like it is right now), then remove it. By deselecting the trend line, we ensure the indicator does remove it from the exclusions list. If deselect reminders have not been disabled, you will also see a message box popup reminding you to do this. [Exclusions: Deselect trend line] Version 3.0 onwards uses the 'shift-click' method so remembering to deselect is avoided entirely.
- Now, we can click the ALL button again to toggle everything back on. Then click it again and you'll see that only the trend lines remain, exactly as we wanted!
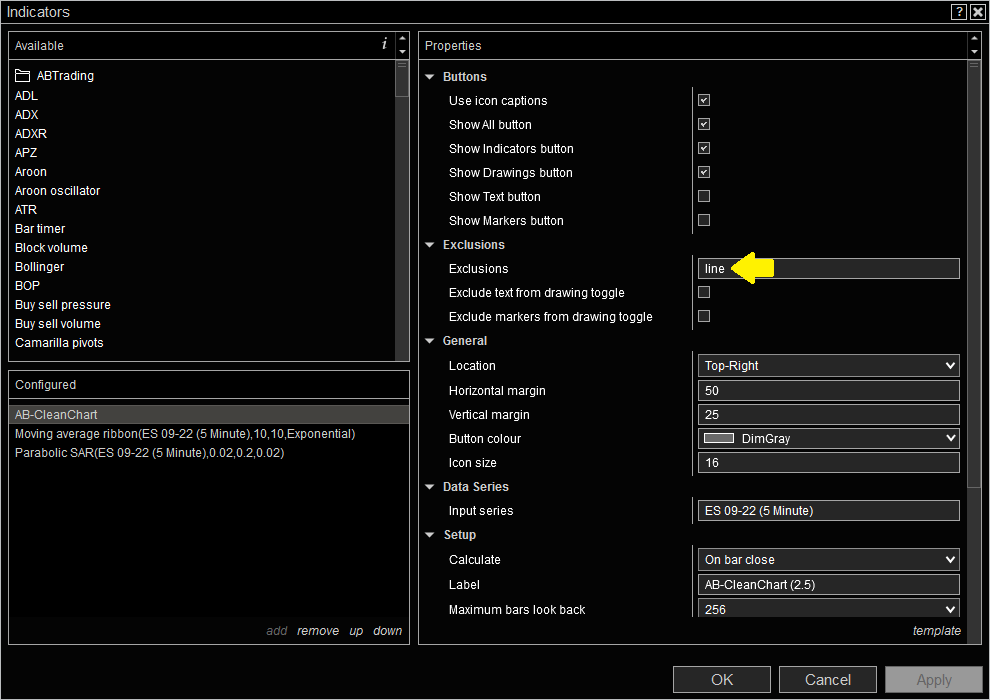
- To fully understand what is going on, you can open the Indicators dialog and look at the AB-CleanChart properties. Notice the Exclusions box is populated with our trend line element (I used the 'line' drawing tool, so it says 'line'). You can add/remove items by name to this list to manage your exclusions in addition to the point-and-click method we just used. [Exclusions: Indicator properties]
- To un-exclude our trend lines from being toggled, you can either remove them from the Exclusions list in the indicator properties or you can use the point-and-click method again. Let's quickly run through the latter option...
- Close the indicators window if you still have it open.
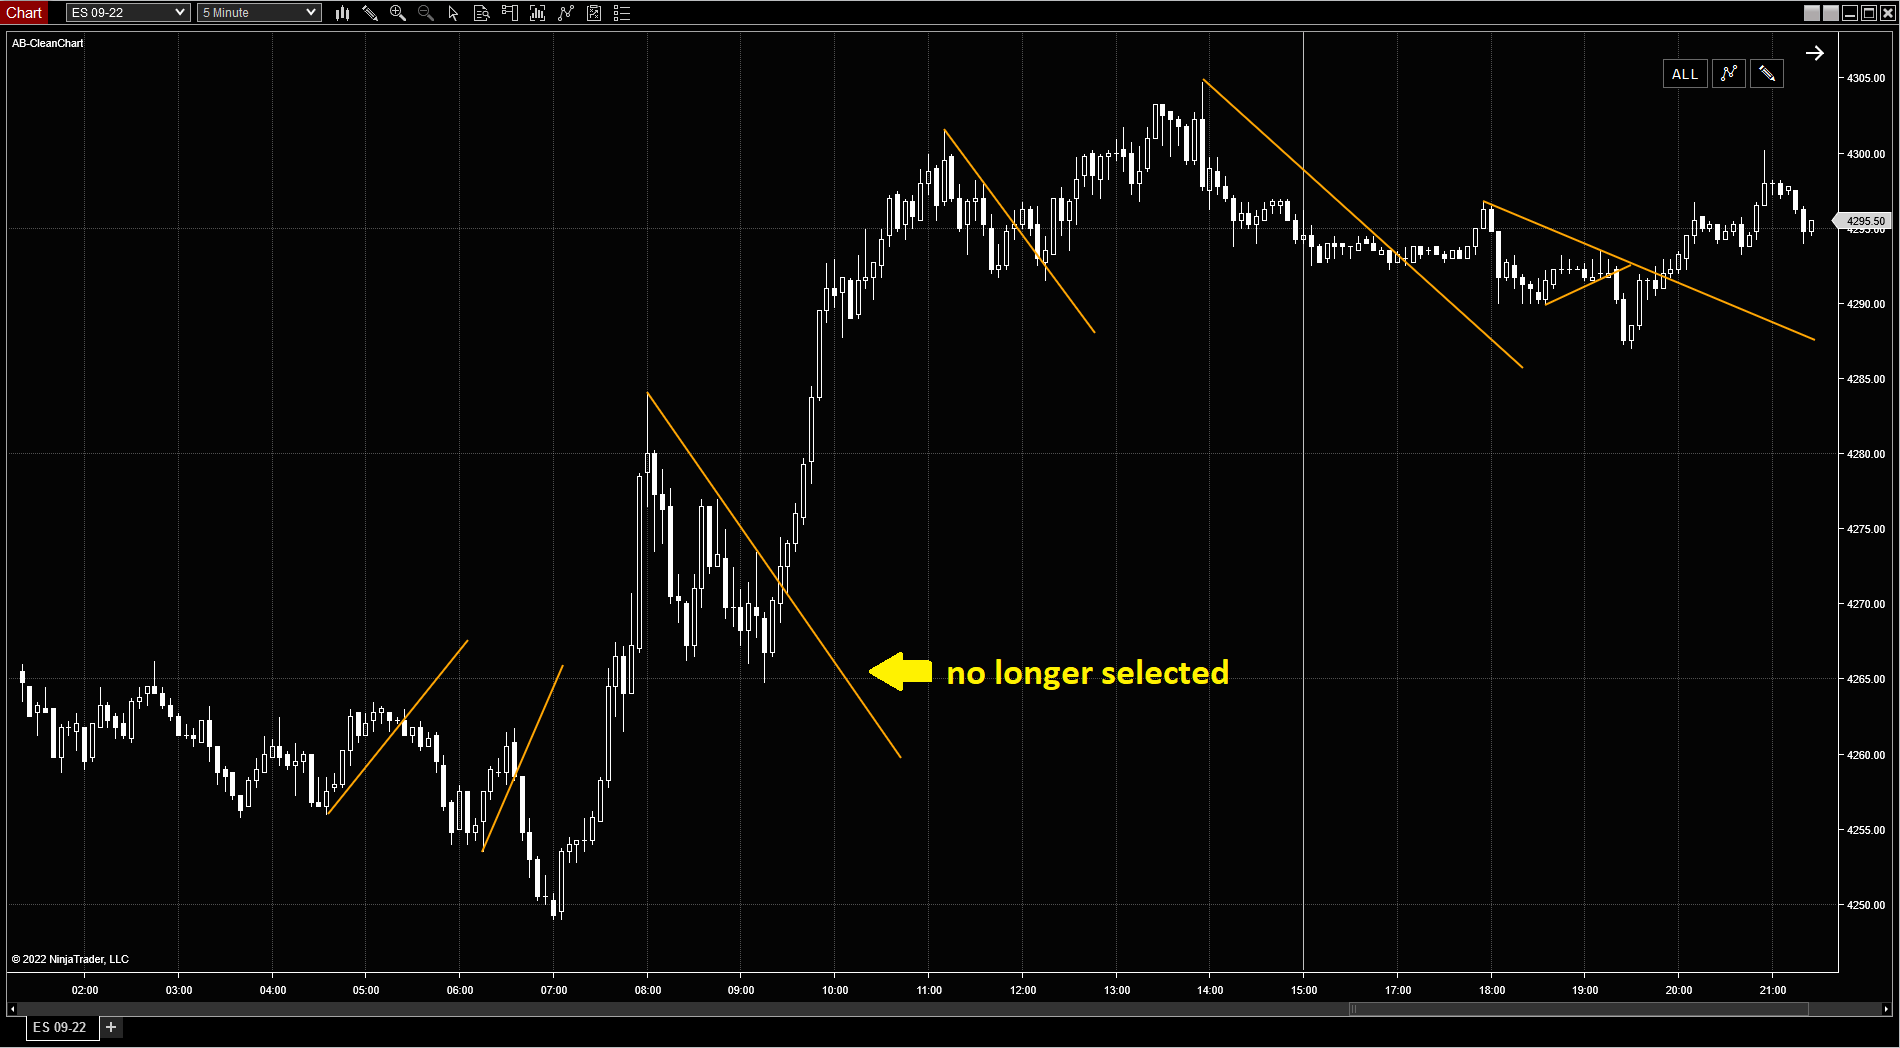
- Toggle the ALL button until everything is visible again (optional, but makes it easier to understand what's happening). Click any trend line to select it.
- Hold down the SHIFT key (either one) and click on the Drawing Tool toggle or the ALL toggle button. Notice the trend lines have been removed. They are obviously no longer on the exclusion list.
- If using a version prior to version 3.0: Click on the chart to deselect the trend line so our changes 'stick'. If deselect reminders have not been disabled, you will see a message box popup reminding you to do this.
- Play with the toggles and you'll see the trend lines now toggle along with everything else.
- As an exercise, try excluding the Parabolic SAR using the same methods we used in this example. If you can do that, you've mastered exclusions :-)
disable deselect reminders
This only applies to versions prior to 3.0. Version 3.0 onwards uses the 'shift-click' exclusion method and, thus, deselect reminders are no longer required.
After you have used this indicator for a while, you may find the reminders to deselect to apply exclusions annoying. If so, you can disable them by deselecting the Enable deselect reminder parameter in the Indicator Properties. [Exclusions: Disable reminders]
You can make this the default by updating the default template for the indicator:
- Open the Indicator Properties.
- Deselect the Enable deselect reminder parameter.
- Click the template button near the bottom-right of the properties window and click save.
- Click the Save as Default button.
- Click OK to close the Indicator Properties window. [Animation: Disable reminders by default]
inspector
As noted in the 'Exclusions' section above, you may manage your exclusions directly in the indicator properties using the Exclusions list parameter. This parameter accepts a comma-separated list of elements by name which should be excluded from toggling. How do you get an element's name? There are three common methods:
- The most obvious way to get an elements name would be to use the point-click-click method explained in the 'Exclusions' section and then check the properties. You will see all excluded element names in the Exclusions list parameter.
- If you are looking for an indicator name, you can find it in the Indicators Dialog on the left side. Indicator names are exactly as they appear in the upper 'Available' list. Just remember that spaces are important but case is not. [Exclusions: Indicator names]
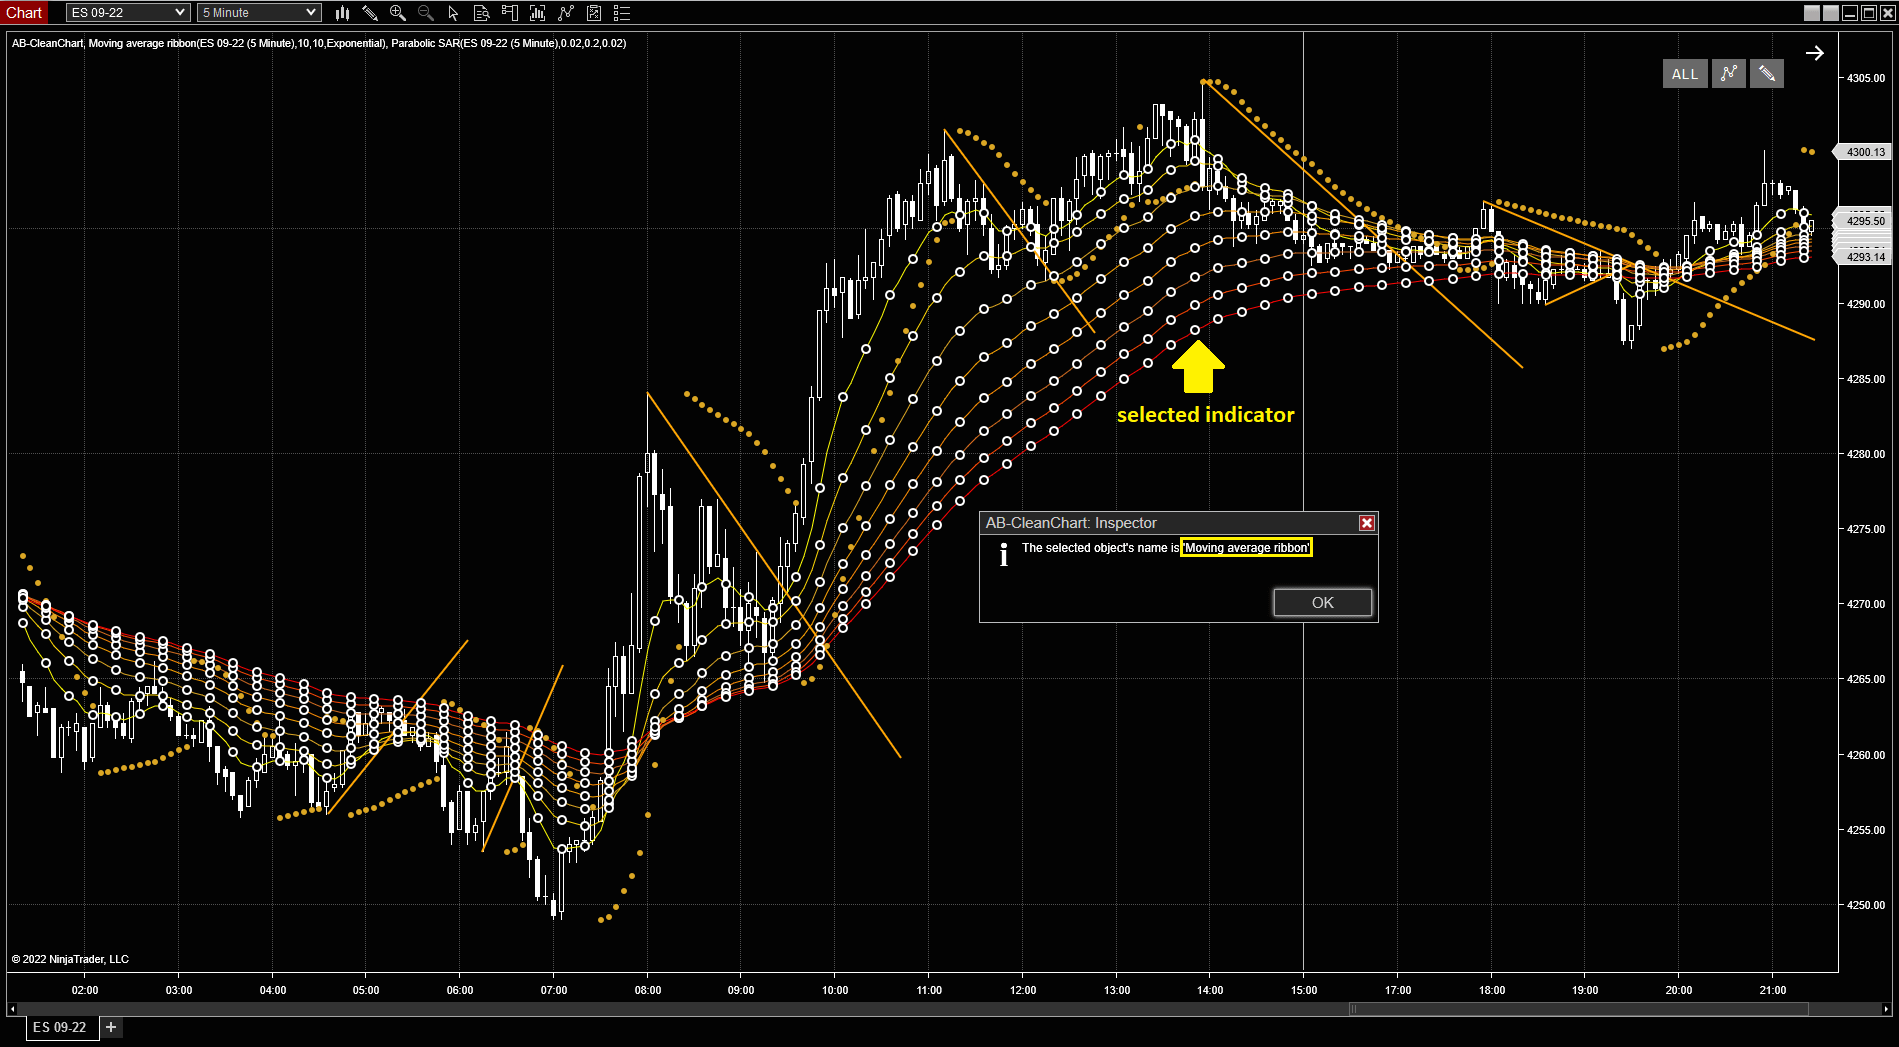
- For trickier items such as Drawing Tools or third-party custom items, you can use the included Inspector. In fact, this is probably the fastest and easiest method.
While AB-CleanChart is attached to a chart, you can left-click on any chart object while holding down the left-CTRL and left-shift keys. This will generate a popup dialog box telling you the name of the element you clicked on. You can then copy this name exactly into your Exclusions list parameter. Remember, spacing is important but case is not. [Exclusions: Inspector]
Parameters
Click on any of the options below to expand it and read a more detailed explanation of what the particular parameter does. This section will be updated with each new release version.
buttons
Exclusions
General
contact me
Want to stay updated on new releases? Have questions or found a bug? Want to submit a feature request? Feel free to email me by clicking the button below. I'll be happy to answer any questions you have, help you get the indicator set-up, or let you know about incorporating your suggestion(s) into future versions. If you know how to program for NinjaTrader or in C#/.NET in general and want to contribute, email me using the button below or file an issue or pull request in the git repo (preferred).
email me