The indicator is easy to use and works like most other NinjaTrader indicators. Once installed, simply select it from the 'Indicators' dialog box in the ABTrading folder, set the options as desired (defaults are pretty sane) and start using it. I tried to give all the options names that make sense and, if you hover over them with your mouse, I've included more detailed descriptions as appropriate. Overall, I don't think there is too much that's a mystery. However, this page will provide an overview just in case something doesn't make sense to you.
Download Instructions
You can download the latest version of AB-NC-30/30 Power Reversal here . Make sure you save the file somewhere you can find it easily -- your Downloads folder or your Desktop are usually the easiest places. If you wish to verify your download, the SHA-256 checksum is displayed below the download button for each release on the Downloads page.
Installation, Upgrades & Removal
installation
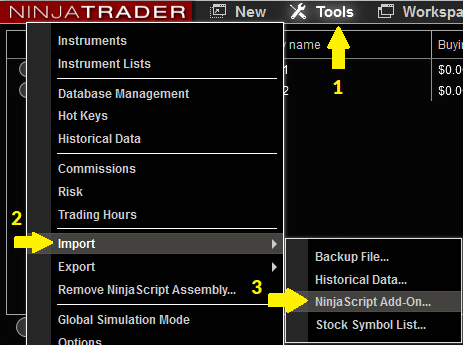
Open NinjaTrader and go to the main control window (the one with the main program menu) and select Tools | Import | NinjaScript Add-On... [Installation screenshot 1]
Navigate and find the ZIP file you downloaded. Select it and click "Open". NinjaTrader will install the file for you.
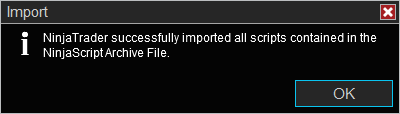
Assuming there are no errors, you should see a dialog box saying "NinjaTrader successfully imported all scripts contained in the NinjaScriptArchive File." [Installation screenshot 2]
That's it, you're done!
upgrading
Upgrading involves removing the previous version and then installing the new version just as you did in the initial installation.
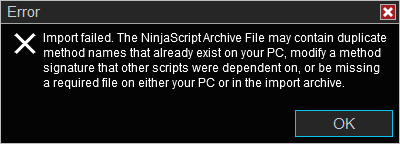
You MUST remove the previous version or NinjaTrader will fail to perform the upgrade. If you don't remove the previous version, you will see a dialog box saying "Import failed..." [Screenshot showing upgrade error]
Follow the steps in the "Uninstallation" section below to remove the current (old) version.
Now, follow the steps in the "Installation" section above to install the newest version. Just make sure you choose the newest ZIP (it will have the highest version number) and that will do the "upgrade" for you. Upgrading really is just installing the latest version. Your existing templates will be unaffected and will be automatically reapplied after the upgrade.
removal
It is recommended you remove any custom indicators from within NinjaTrader instead of deleting the file manually (though I've never experienced any problems manually deleting files). We will go through the recommended procedure here.
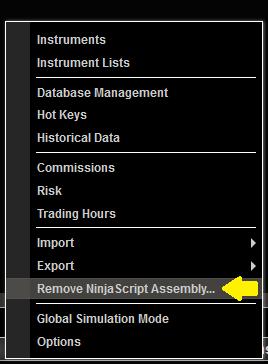
On the main NinjaTrader Control Center window (the one with the main program menu), select Tools | Remove NinjaScript Assembly [DLL uninstallation screenshot 1]
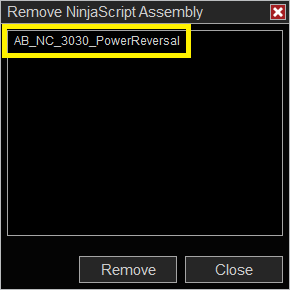
A new window will appear asking you to select which assembly you want to remove. Select AB_NC_3030PowerReversal and click "Remove". [DLL uninstallation screenshot 2]
NinjaTrader will display a confirmation dialog box asking if you're sure. You are. Say Yes.
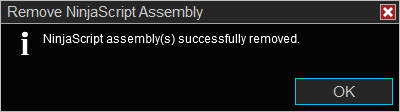
Assuming no errors, you will get a success message. Click OK to close the dialog box. [DLL uninstallation screenshot 3]
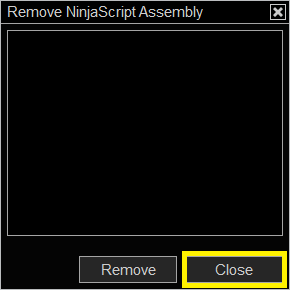
Click CLOSE on the "Remove NinjaScript Assembly" dialog box to close it. [DLL uninstallation screenshot 4]
AB-NC-30/30 Power Reversal is now uninstalled. If you removed the indicator as part of the upgrade process, please follow the "Installation" section above to complete the upgrade.
Using In NinjaTrader
You add the indicator to your chart like any other. In the chart window, right-click and select Indicators (or click the indicators button in the toolbar) to open your indicators panel. Now look for a folder called "ABTrading" on the left side of the window. Double-click to open the folder and then double-click on AB-NC-30/30 Power Reversal(version) to activate the indicator. You can then customize any options you want on the right side of the window and click "OK" to add the indicator. You may change any options or remove the indicator at any time by opening your indicators panel again.
Remember, 'splitting' your screen to display the longer timeframe as an additional data series is NOT necessary. The indicator will load the higher-timeframe data automatically in the background and monitor it for you. If you are playing around with customizing settings, however, you may want to open a split screen to understand what your settings are really 'looking at' in the higher timeframe. To do this:
- Right-click on your chart and select "Data Series...".
- Select the same instrument as your current one in the "Instrument" drop-down at the top-left of the dialog box.
- On the right-half of the window, alter the new data-series as desired (usually just changing the timeframe).
- Make sure your new data-series is listed UNDER your active (shorter timeframe/main) chart!
- Click OK.
If/when you want to undo the split screen, just open "Data Series..." again, "remove" the secondary data-series and click OK.
alerts
You can use the standard NinjaTrader alert system in addition to or instead of the indicator generated alerts. In fact, I recommend this method over the indicator-generated alerts because it is more flexible. When configuring your alerts using NinjaTrader, your criteria will be:
- Indicator value equals 1: LONG signal
- Indicator value equals -1: SHORT signal
There is a huge variety of ways you can configure alerts, so it is beyond the scope of this documentation. More information about the alerts system can be found in the NinjaTrader official documentation . The alerts dialog is pretty complicated so you might find this YouTube video about NinjaTrader alerts or this YouTube video with some alert examples helpful.
Interpretation
Ultimately, this strategy is not a full-fledged trading approach on its own. It should be more of a tool in your arsenal since signals may not necessarily trigger often enough and, when they do, they still require some discretion as to whether the trade should be taken and where your stop should be placed. It is often the case that signals are too early and, sometimes, too late. Remember that you are trading on a very short timeframe with signals from a comparatively very long timeframe. Therefore, your targets should be pretty small and your stops should be tight enough so you can afford to be wrong pretty often but not so tight that the market has no 'wiggle-room'. I strongly suggest playing with this system in "playback" mode and/or in a simulated account until you find a way to use the signals that works for your trading personality and unique situation.
All that being said, in the right circumstances, this strategy can provide great scalping-type signals. In my experience, it works best in the direction of the overall trend (NOT in sideways markets!) and when combined with some form of entry filter. The examples below are, obviously, taken from successful trades as a means to help you understand how the indicator works. Future versions may incorporate some filters but, in the meantime, that's up to you as a trader!
Long setup
Let's go ahead and take a look at aLONG trade setup first. Remember, it's up to you to find a way to interpret these signals and filter them!
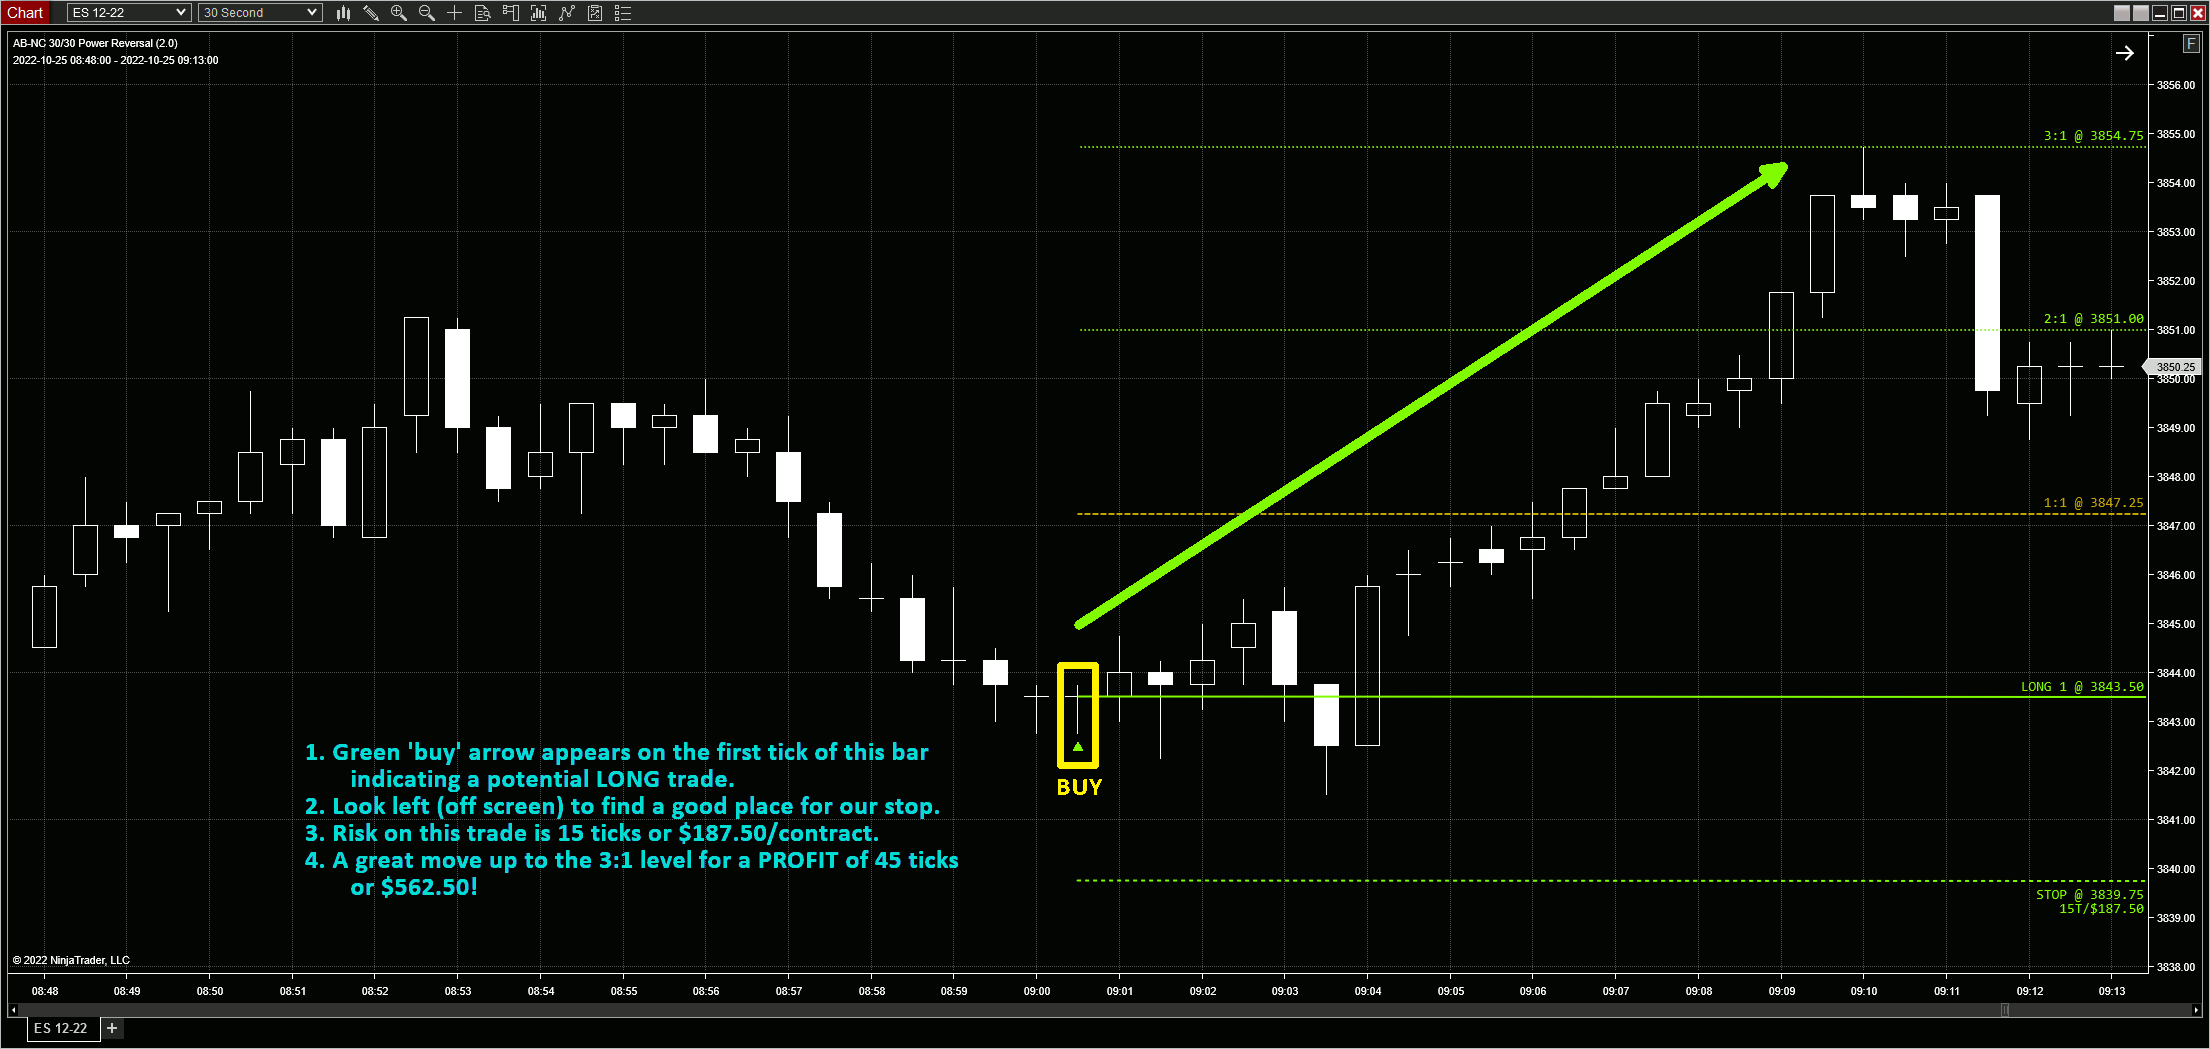
- A signal is indicated and a green up triangle is plotted on the first tick of the bar. This bar is outlined yellow in the screenshot. Ninjacators recommends you place your trade at market ASAP (basically right at the open of the bar, that's why the arrow shows up right away). For this example, let's assume we get LONG at the open price of 3843.50.
- You need to find a good place for your stop. I usually just look left and find a recent low with good (stopping) volume. In this case, I put a stop at 3839.75. Total risk is 15 ticks, or $187.50/contract.
- After a small move against our position, the market takes off and hits our 3:1 target at 3854.75. This is a PROFIT of 45 ticks, or $562.50/contract.
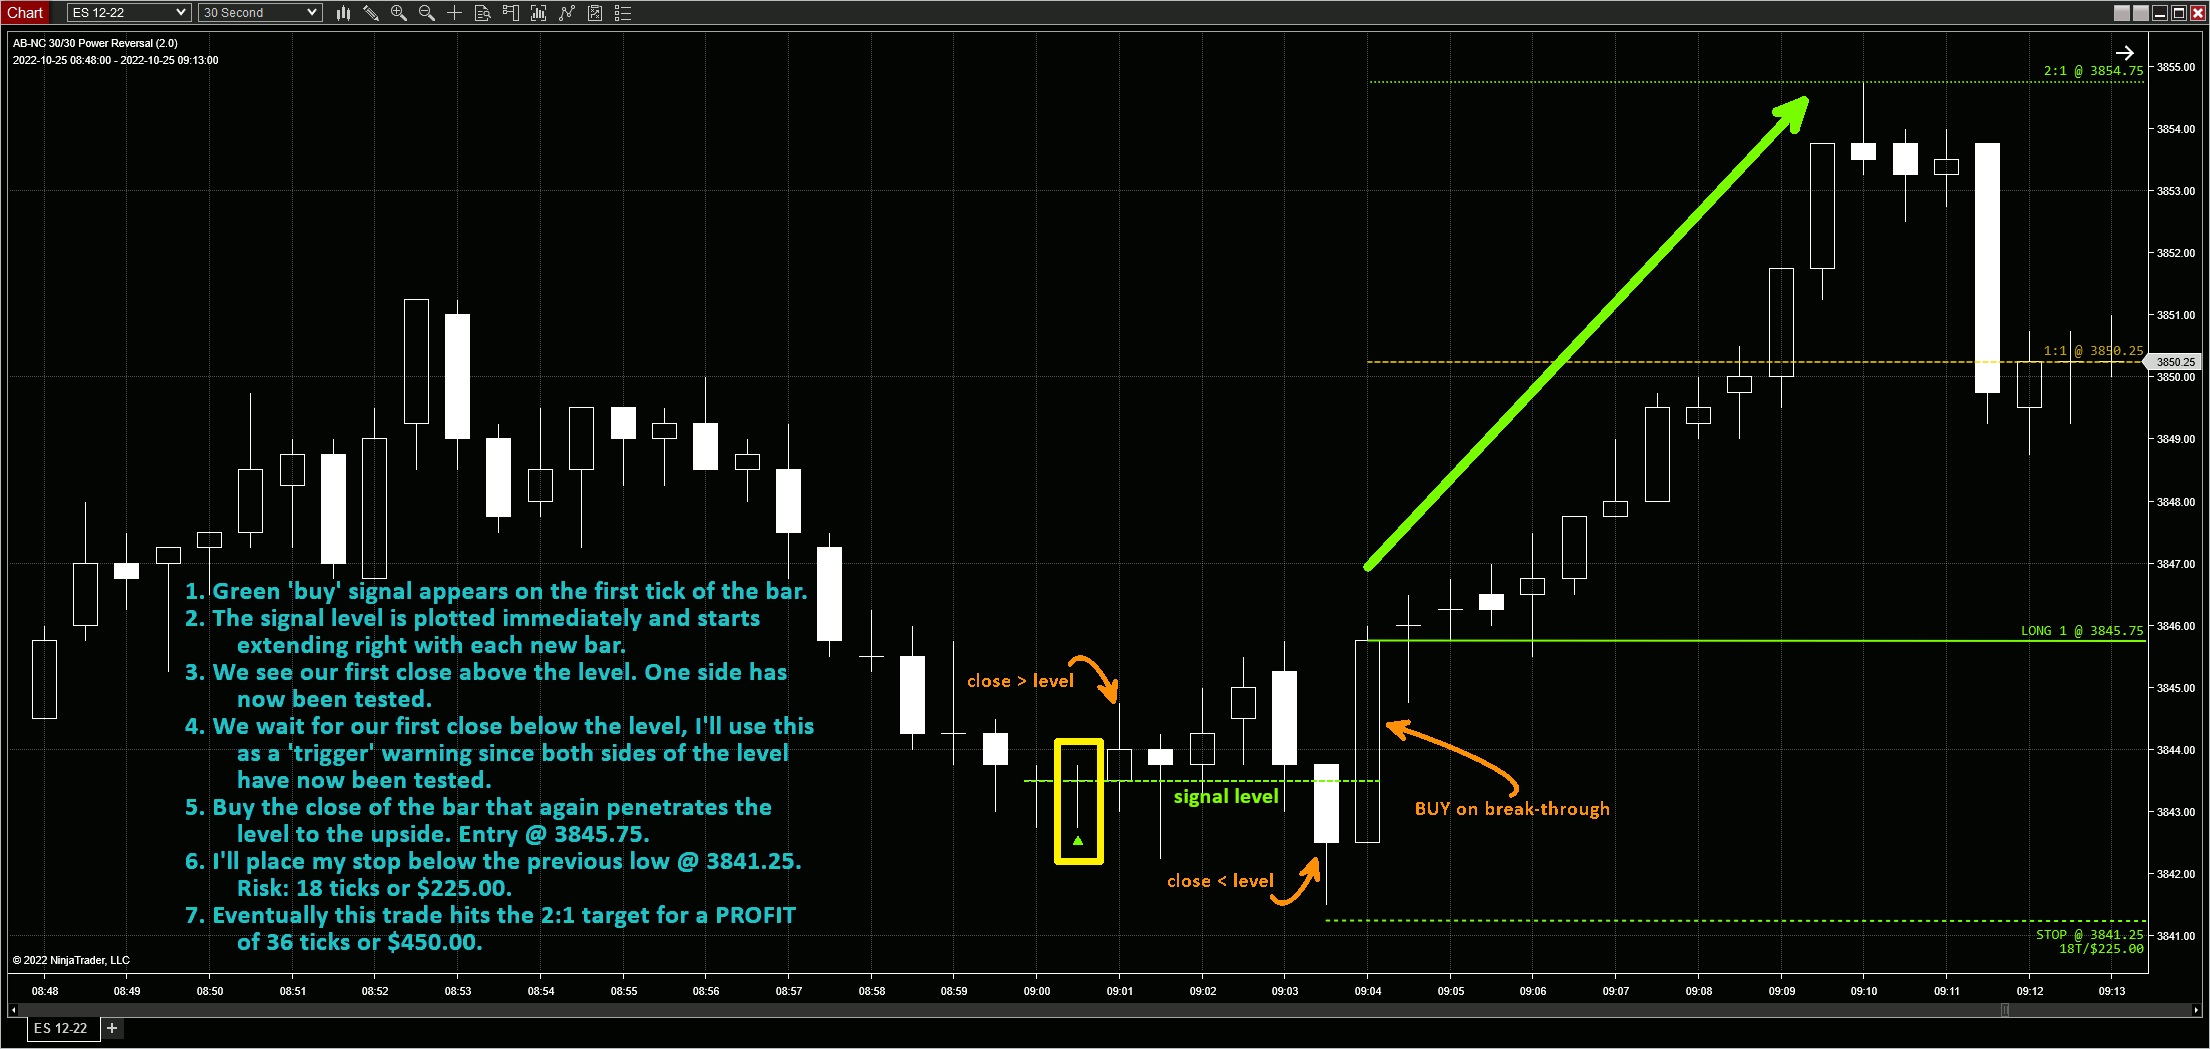
Starting in Version 2.0, there is an option to plot signals as a price level. This is experimental and not officially part of the system, but it's something I've been playing with as a method of re-entering a stopped out trade and as an easier way to define my stop levels. Here's the same trade with an example of how I use the level feature.
- A signal is indicated by a green up triangle and plotted on the first tick of the bar. The bar is outlined yellow in the screenshot.
- Since we are using the levels feature, a price level is also plotted immediately and starts extending right with each new bar.
- The next bar closes in our direction and it starts to look like we missed the boat! However, this is also the first test of the topside of the level.
- Five (5) bars after this, we close below the level which is a test of the bottom-side of the level.
- The next bar blasts back above the level having already oscillated around the level. Looks like a good buy to me!
- Enter long on the close of this bar @ 3845.75.
- Here's why I like the levels: We have a clear stop -- the last low on the 'wrong' side of the level! Stop @ 3841.25. Risk: 18 ticks, or $225.00/contract.
- This trade never moves against us and eventually hits the 2:1 target at 3854.75. Total PROFIT of 36 ticks, or $450.00/contract.
Short setup
Now, let's take a look at a SHORT trade setup. Remember, it's up to you to find a way to interpret these signals and filter them!
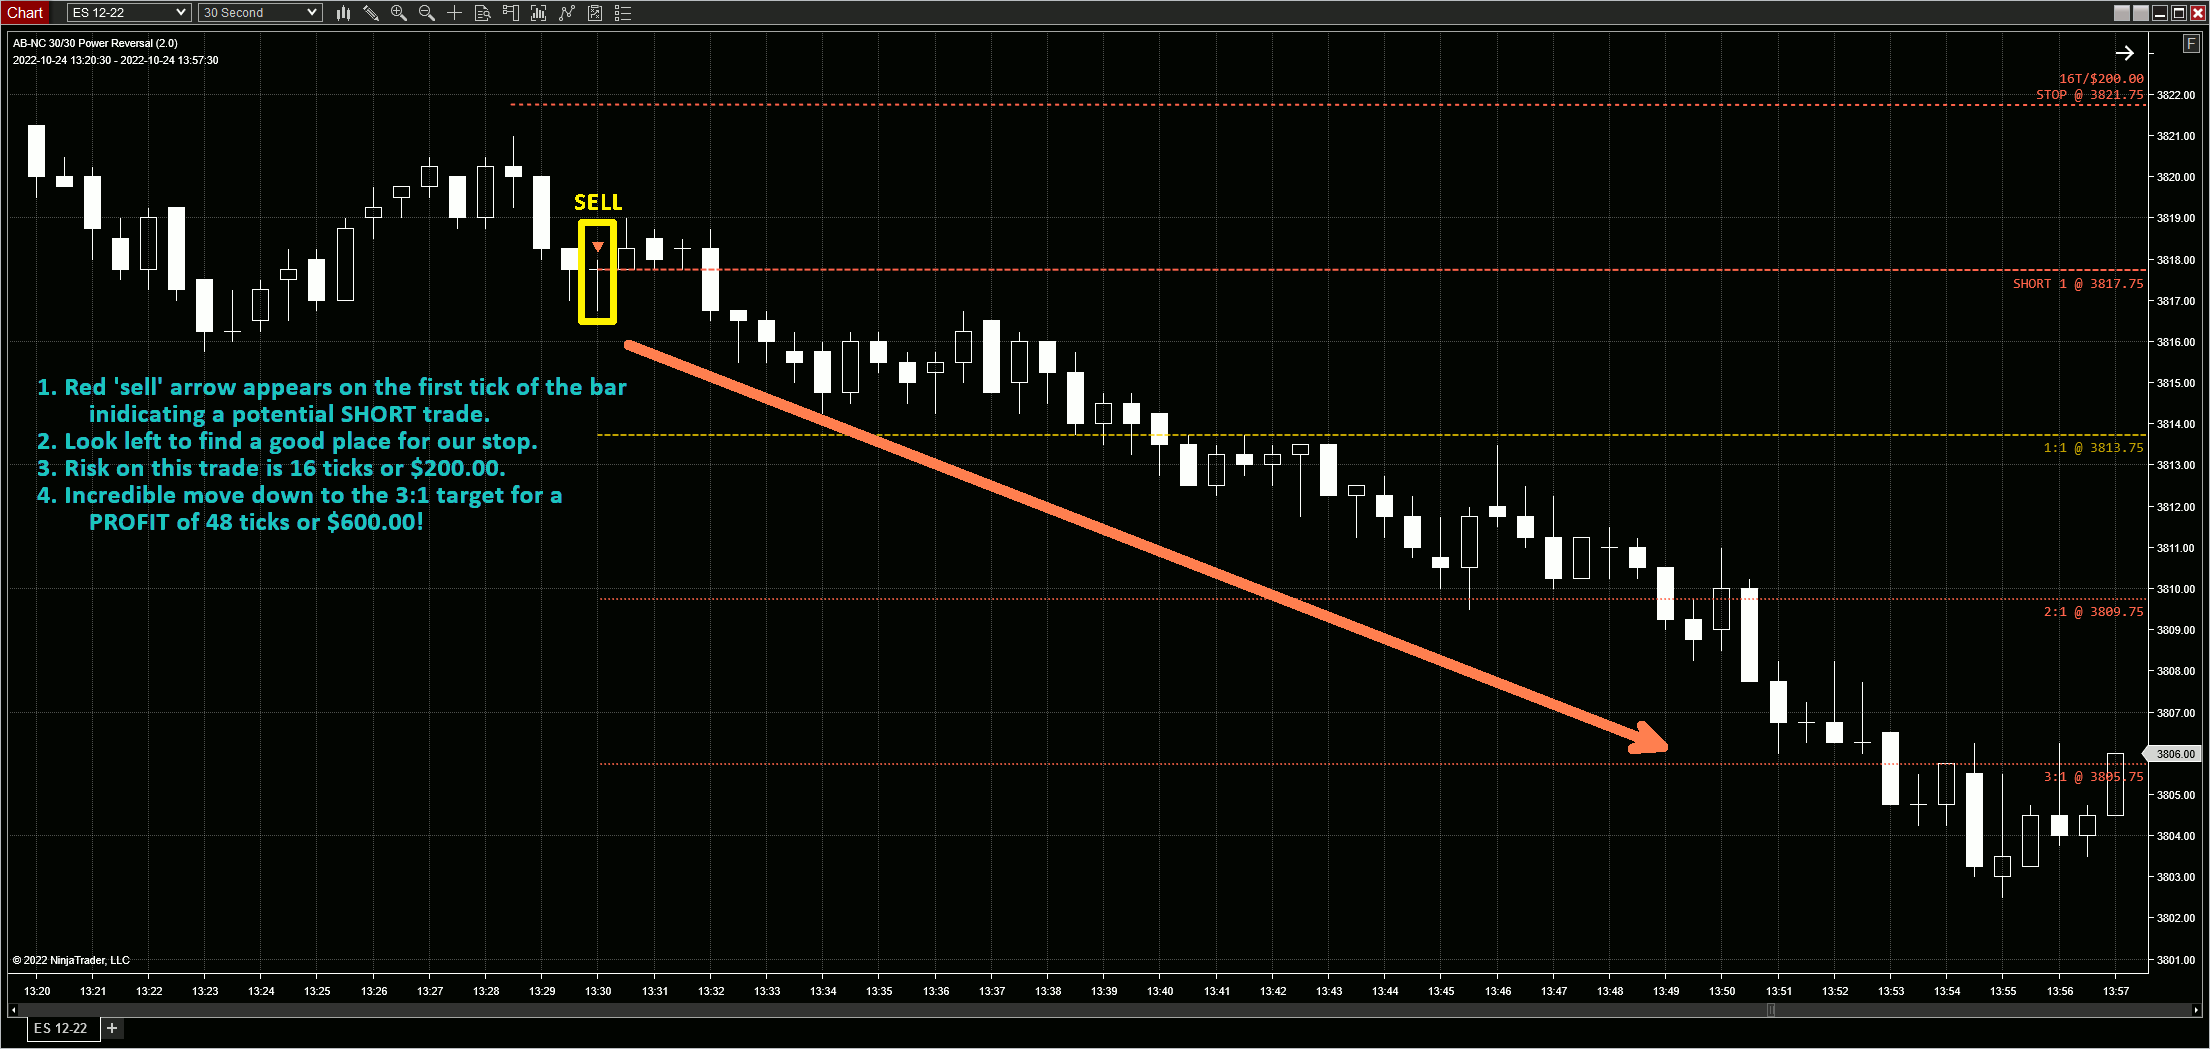
- A signal is indicated and a red down triangle is plotted on on the first tick of the bar. This bar is outlined yellow in the screenshot. Ninjacators recommends you place your trade at market ASAP (basically right at the open of the bar, that's why the arrow shows up right away). For this example, let's assume we get SHORT at the open price of 3817.75.
- Now, find a good spot for your stop. I usually look left and find a recent high with good (stopping) volume. In this case, I put a stop at 3821.75. Total risk is 16 ticks, or $200.00/contract.
- This trade moves pretty quickly and spectacularly in our favour. We easily hit and surpass our 3:1 target. Total PROFIT of 48 ticks, or $600.00/contract.
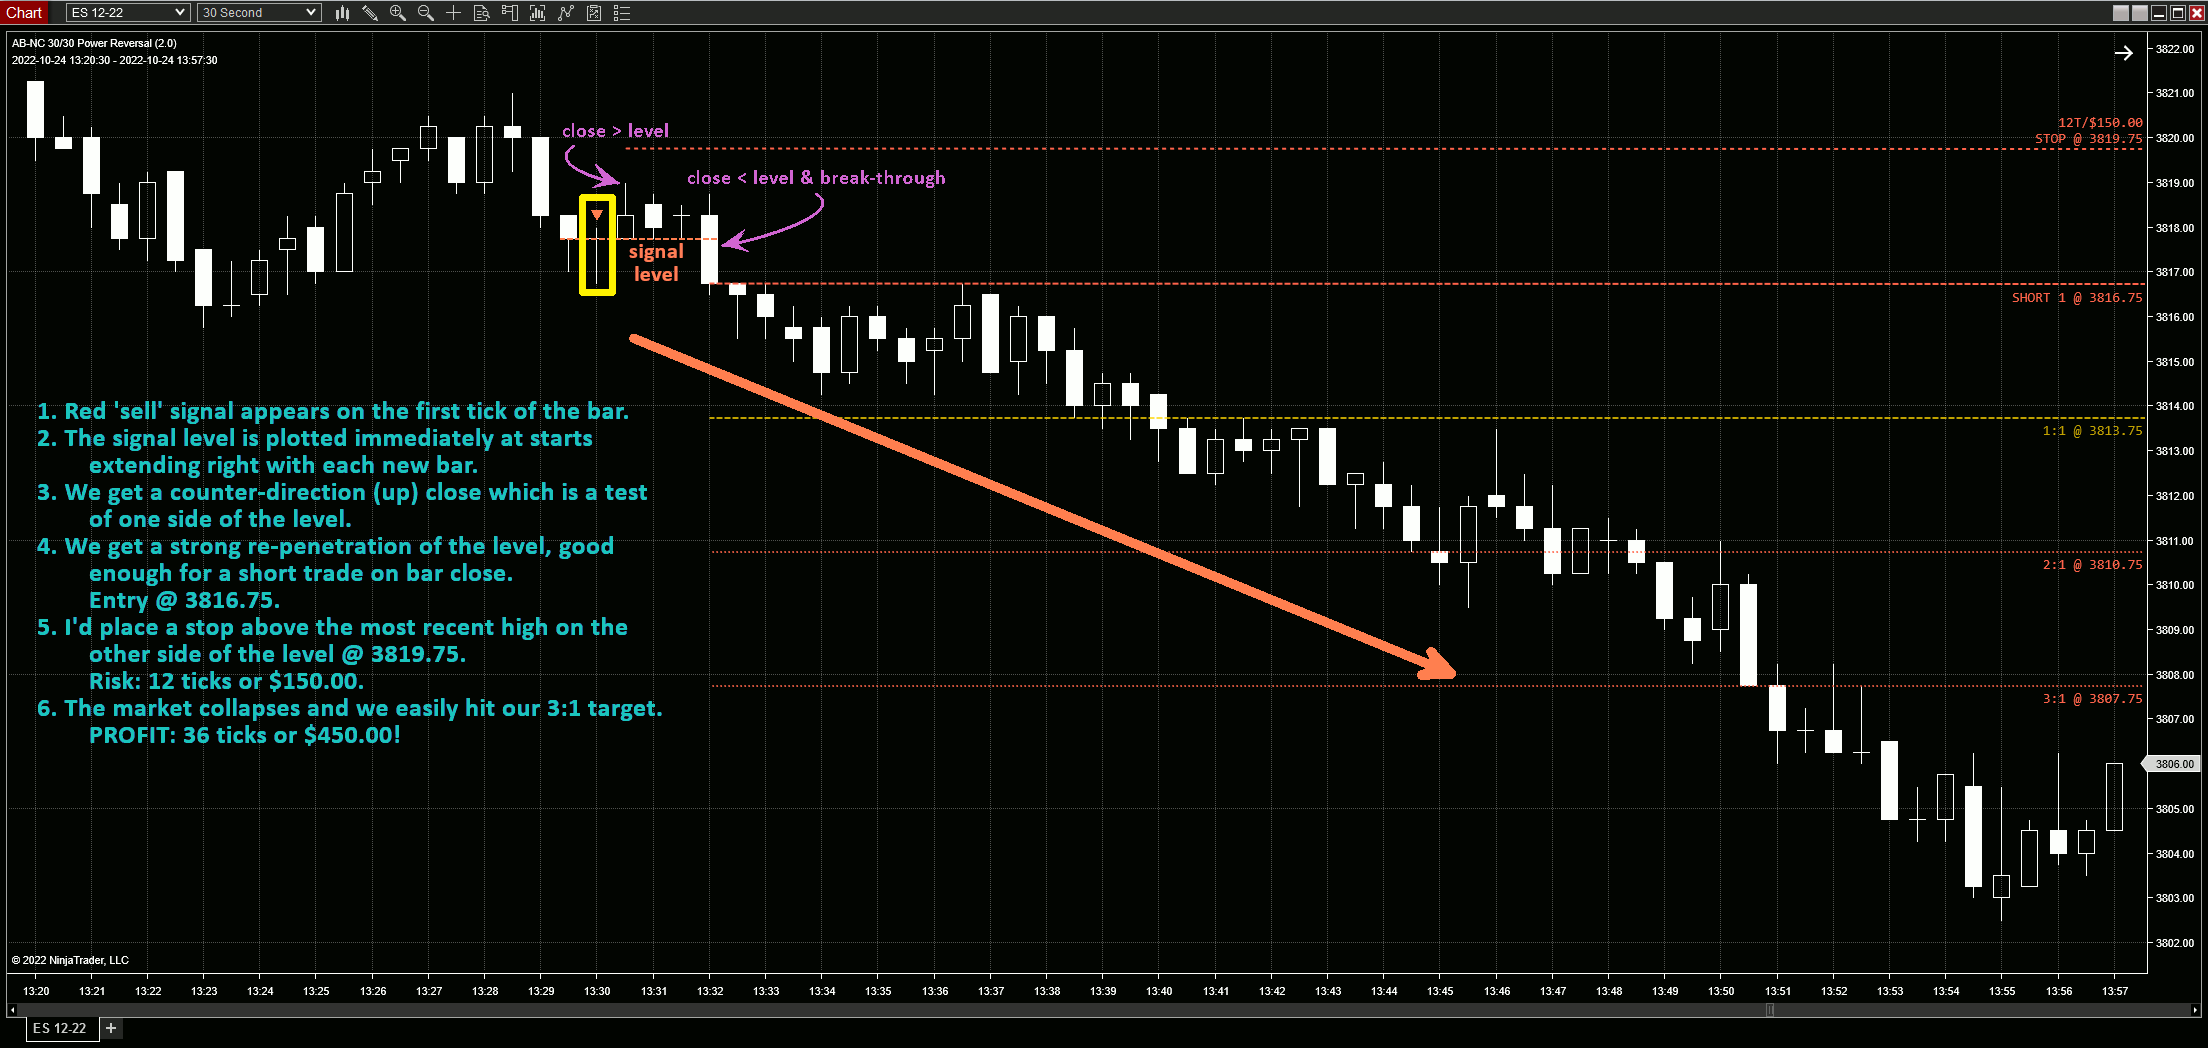
Again, starting with Version 2.0 we have an option for levels. Here's the same trade with an example of how I use the level feature.
- A signal is indicated by a red down triangle and plotted on the first tick of the bar. The bar is outlined yellow in the screenshot.
- Since we are using the levels feature, a price level is also plotted immediately and starts extending right with each new bar.
- The next bar closes counter to our planned trade direction. This is an upside test of the level.
- Three (3) bars later, we have a bar that strongly re-penetrates the level confirming the topside breakout failed. Seems like a reasonable short to me!
- Enter short at the close of this bar at a price of 3816.75.
- Again, our level helps figure out a pretty clear stop area, the highest high on the other side of the level. Buy stop @ 3819.75 creating at total RISK of 12 ticks, or $150.00/contract.
- Once again, this trade never moves against us and it's a whopper! We easily surpass the 3:1 target at 3807.75. Total PROFIT of 36 ticks, or $450.00/contract.
Strategies
Starting with Version 3.0, this indicator is now compatible with the built-in NinjaTrader Strategy Builder, Strategy Analyzer and Strategy Runner tools. This means you can automate your backtests and even deploy your customized strategies for automated realtime trading! In my opinion, the strength of this ability lies in backtesting along with other tools/indicators to act as filters. Only after doing that and "walking your tests forward" should you consider deploying this in actual trading.
The author disclaims any and all responsibility for using this indicator and/or any strategies derived from or using this indicator. It's your money, your trading account and your choice to use or not use this indicator! Please run your own tests and trade responsibly, within your own risk tolerances!
So, what does this new strategy integration allow you to do? In short, you can automate:
- backtesting of threshold settings to find the exact combinations that fit your goals
- backtesting different combinations of stops and profit targets to fit your risk tolerance and accuracy requirements
- deploy your settings in walk-forward testing and even live markets
Although this ability is useful, I would warn you to be careful about over-optimizing, or 'curve-fitting', your settings. Remember to manually test all of your settings and not just rely on what the computer says is optimal. Your settings have to be flexible enough to account for ever-changing future market conditions.
TLDR for experienced traders and programmers
If you're familiar with the NinjaTrader Strategy tools, then you can skip the rest of this overview tutorial and just focus on this section. If you're an experienced programmer and are looking to integrate this into your own custom strategy or indicator suite, then same goes -- you can skip the rest of this tutorial and focus on this section. For those less familiar with the Strategy tools or any non-programmers, please skip to the next section and follow the tutorial.
The indicator generates a transparent plot that either reads '1.00' or '-1.00' (1d or -1d for the programmers out there). It does this on the first tick of the bar on the primary timeframe immediately following the close of whatever bar corresponds to the higher-timeframe bar that just closed. For example, if you are using the default Ninjacators recommended 30-second primary chart and 30-minute longer-timeframe chart set-up and suppose it is 7:45am:
- The next closing higher-timeframe bar would be the 8:00am bar (already in progress).
- Assume this bar meets your 30/30 Power Reversal criteria on close and has a bearish close (indicating a bullish entry) .
- The shorter timeframe bar also closes at 8:00am.
- The first tick of the 8:30:30am bar on the shorter timeframe would generate a plot value of 1.00 (1d for the programmers).
Knowing this, your strategy rules would be as follows:
- Bullish entry: IndicatorValue[0] > 0
- Bearish entry: IndicatorValue[0] < 0
Final notes for programmers:
- The indicator qualified namespace is: NinjaTrader.NinjaScript.Indicators.ABTrading.AB3030PowerReversal
- The indicator employs its own namespace for enums and calculations: AB_Trading.AB3030PowerReversal
Easy, right? Please feel free to contact me if you have questions about integrating this into your own strategies or indicators.
Build a strategy
The easiest way to understand the new strategy integration available in Version 3+ is to build a simple strategy and see how it works. Please note, this strategy is only for illustration purposes so you understand how the indicator works. It is NOT a complete strategy on its own and probably should not be used in live markets with real money! For the remainder of this tutorial, I am going to assume you are using the Ninjacators recommended settings of a 30-second primary chart and a 30-minute higher-timeframe chart. Let's get to it...
- In the NinjaTrader Control Center, go to New > Strategy Builder.
- In the dropdown, select New Strategy and click Next.
- Give your strategy a name (I will use ABPowerReversal in this tutorial) and, optionally, a description. Click Next.
- Now we need to change the default properties: [VIDEO: Strategy - Default Properties]
- Change Calculate to On price change.
- Expand More properties and change Minimum bars required to "0" and Time in force to "DAY".
- Since the indicator requires data from the higher timeframe chart, we need to tell our strategy to load that data: [VIDEO: Strategy - Add Data Series]
- Add a data series: Use primary instrument, Type is "Minute" and Value is "30".
- Let's define some inputs so we can customize things without having to re-build our strategy. For this example, we are only using Inputs. [VIDEO: Strategy - Inputs]
- We need to define inputs for:
- The open threshold, close threshold, minimum body size percentage, rejection wick percentage, rejection multiple, number of ticks for our stop, and number of ticks for our profit target.
- I usually name variables as follows: OpenThreshold, CloseThreshold, BodyMinimum, RejectionPct, RejectionMultiple, StopTicks, ProfitTicks
- Please ensure you set the indicator Preset to Manual. If you don't, any customizations you make to the thresholds will be ignored!
- Please ensure you set the Longer timeframe to whatever you chose in step 5 (in this example, "30"). If you don't, NinjaTrader will throw an error about referencing data that is not loaded.
- Please consult the video if you need help setting these inputs.
- We need to define inputs for:
- Okay, the fun part! Let's define our entry conditions and actions: [VIDEO: Strategy - Conditions and Actions]
- Set 1:
- Condition: AB3030PowerReversal(30, ThresholdPresets.Manual, OpenThreshold, CloseThreshold, BodyMinimum, RejectionPct, RejectionMultiple>)[0] > 0
- Action: EnterLong(DefaultQuantity, @"3030Long1")
- Set 2:
- Condition: AB3030PowerReversal(30, ThresholdPresets.Manual, OpenThreshold, CloseThreshold, BodyMinimum, RejectionPct, RejectionMultiple)[0] < 0
- Action: EnterShort(DefaultQuantity, @"3030Short1)
- Please consult the video if you need help deriving the above settings.
- Set 1:
- Finally, let's define some simple stops and targets: [VIDEO: Strategy - Default Properties]
- SetStopLoss(CalculationMode.Ticks, StopTicks)
- SetProfitTarget(CalculationMode.Ticks, ProfitTicks)
- You're done! Click Finish and let NinjaTrader compile your new strategy.
Strategy Analyzer
Now that you have a strategy, you can backtest and optimize it using the Strategy Analyzer. Because we set all of our thresholds as inputs, along with our stop and profit target levels, we can customize these without having to 'rebuild' it. Plus, the Strategy Analyzer can help us automatically optimize these values!
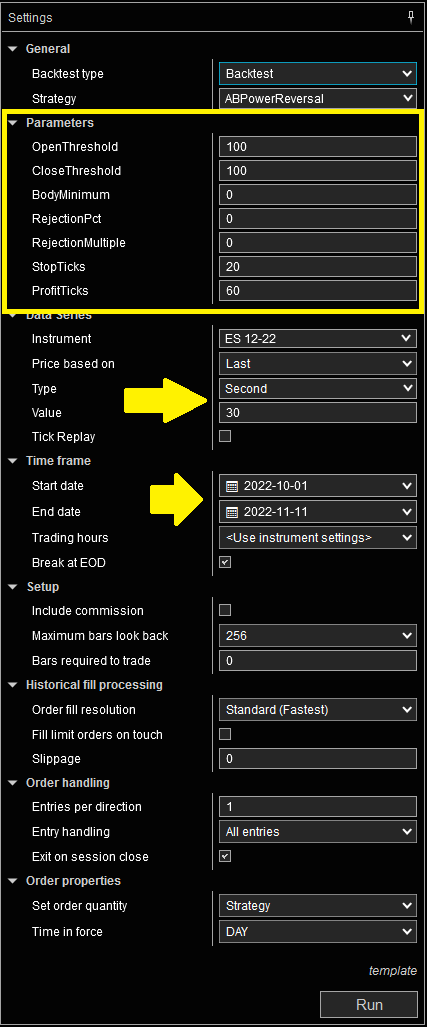
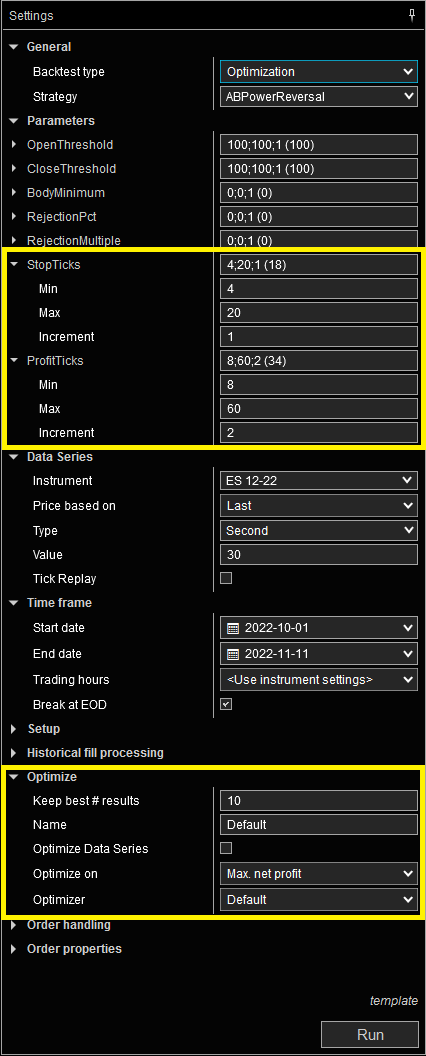
When you open the Strategy Analyzer and select the strategy you just built, you will asettings panel like this. Notice the parameters section allows us to customize everything. Ensure you set the Data Series as appropriate for your tests, especially the Type and Value settings. Finally, make sure the Time frame section has the correct Start date and End date and that you actually have downloaded data for that period. After all that, click Run and start tinkering!
If you're interested in optimization, change the Backtest type under the General section of the settings pane to Optimization. Yoursettings panel should now look like this. Notice each parameter is now a dropdown. You can select minimum, maximum and increment values. In the sample screenshot, I highlighted the stop and profit target parameters. You can see that I have chosen to optimize stops between 4-20 ticks with an increment of 1 tick. This means the optimizer will run tests using a stop of 8 ticks, then 9 ticks, then 10 ticks, etc. For the profit target, I set 8-60 ticks with an increment of 2 ticks. As such, the optimizer will test a profit target of 8 ticks, 10 ticks, 12 ticks, etc. Toward the bottom of the settings panel, you will see the Optimize section where you can specify how many results to report along with the Optimize on setting. This will display an entire list of things you can optimize including net profit, profit factor, accuracy, etc. Have fun and remember not to over-optimize!
Going live
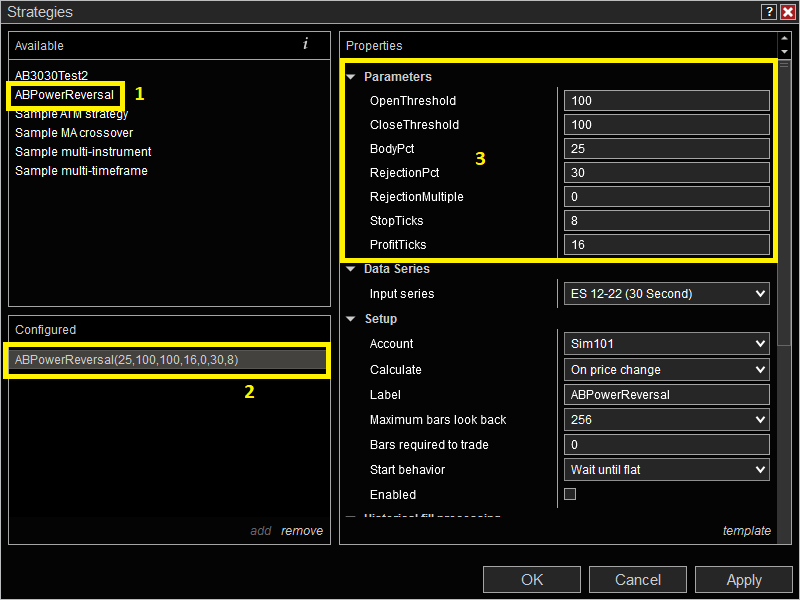
Once you've developed your strategy and tested it, you can attach it to your live charts to forward-test or automate your actual trades. On a chart, click the Strategies button or right-click and select Strategies.A new window will pop-up listing your strategies. Select your strategy ("1" in the screenshot) so that it appears in the Configured window pane ("2" in the screenshot). Alter your settings as desired, perhaps based on your Strategy Analyzer optimizations ("3" in the screenshot), and click Apply. Enable the strategy by clicking the Enabled checkbox in the settings and click OK. Your strategy is set to go! Good luck!
Tips & Ticks
Remember, this strategy is not a full system! It is a tool in your arsenal that provides short-term signals here and there for some quick additional scalp-style trades.
Signals are most effective going in the direction of the prevailing trend and do not work well in sideways markets.
I strongly suggest you play with this system in simulator-mode or market-playback to get familiar with the signals and how they manifest. You should take some time to get a feel for where stops should be placed and how to filter your entries.
It might well be worth your time to play with the candle-formation criteria in the indicator parameters to find settings that provide more or less frequent signals based on your own trading approach, risk tolerance and personality.
If you have suggestions for filters (I have a few in mind I might implement in future versions) or enhancements then please email me so I can incorporate them and everyone can benefit!
PLEASE feel free to make suggestions for new features, changes to existing ones, report any bugs/issues or provide any feedback you'd like. You can email me using the links on this site or, if you are familiar with git, you can file an issue in the git repo.
Parameters
Click on any of the options below to expand it and read a more detailed explanation of what the particular parameter does. This section will be updated with each new release version.
Timeframe
Thresholds
Markers
Levels
Alerts
contact me
Want to stay updated on new releases? Have questions or found a bug? Want to submit a feature request? Feel free to email me by clicking the button below. I'll be happy to answer any questions you have, help you get the indicator set-up, or let you know about incorporating your suggestion(s) into future versions. If you know how to program for NinjaTrader or in C#/.NET in general and want to contribute, email me using the button below or file an issue or pull request in the git repo (preferred).
email me